Bulletin of the Atomic Scientists
Data Visualization / Print / 2021
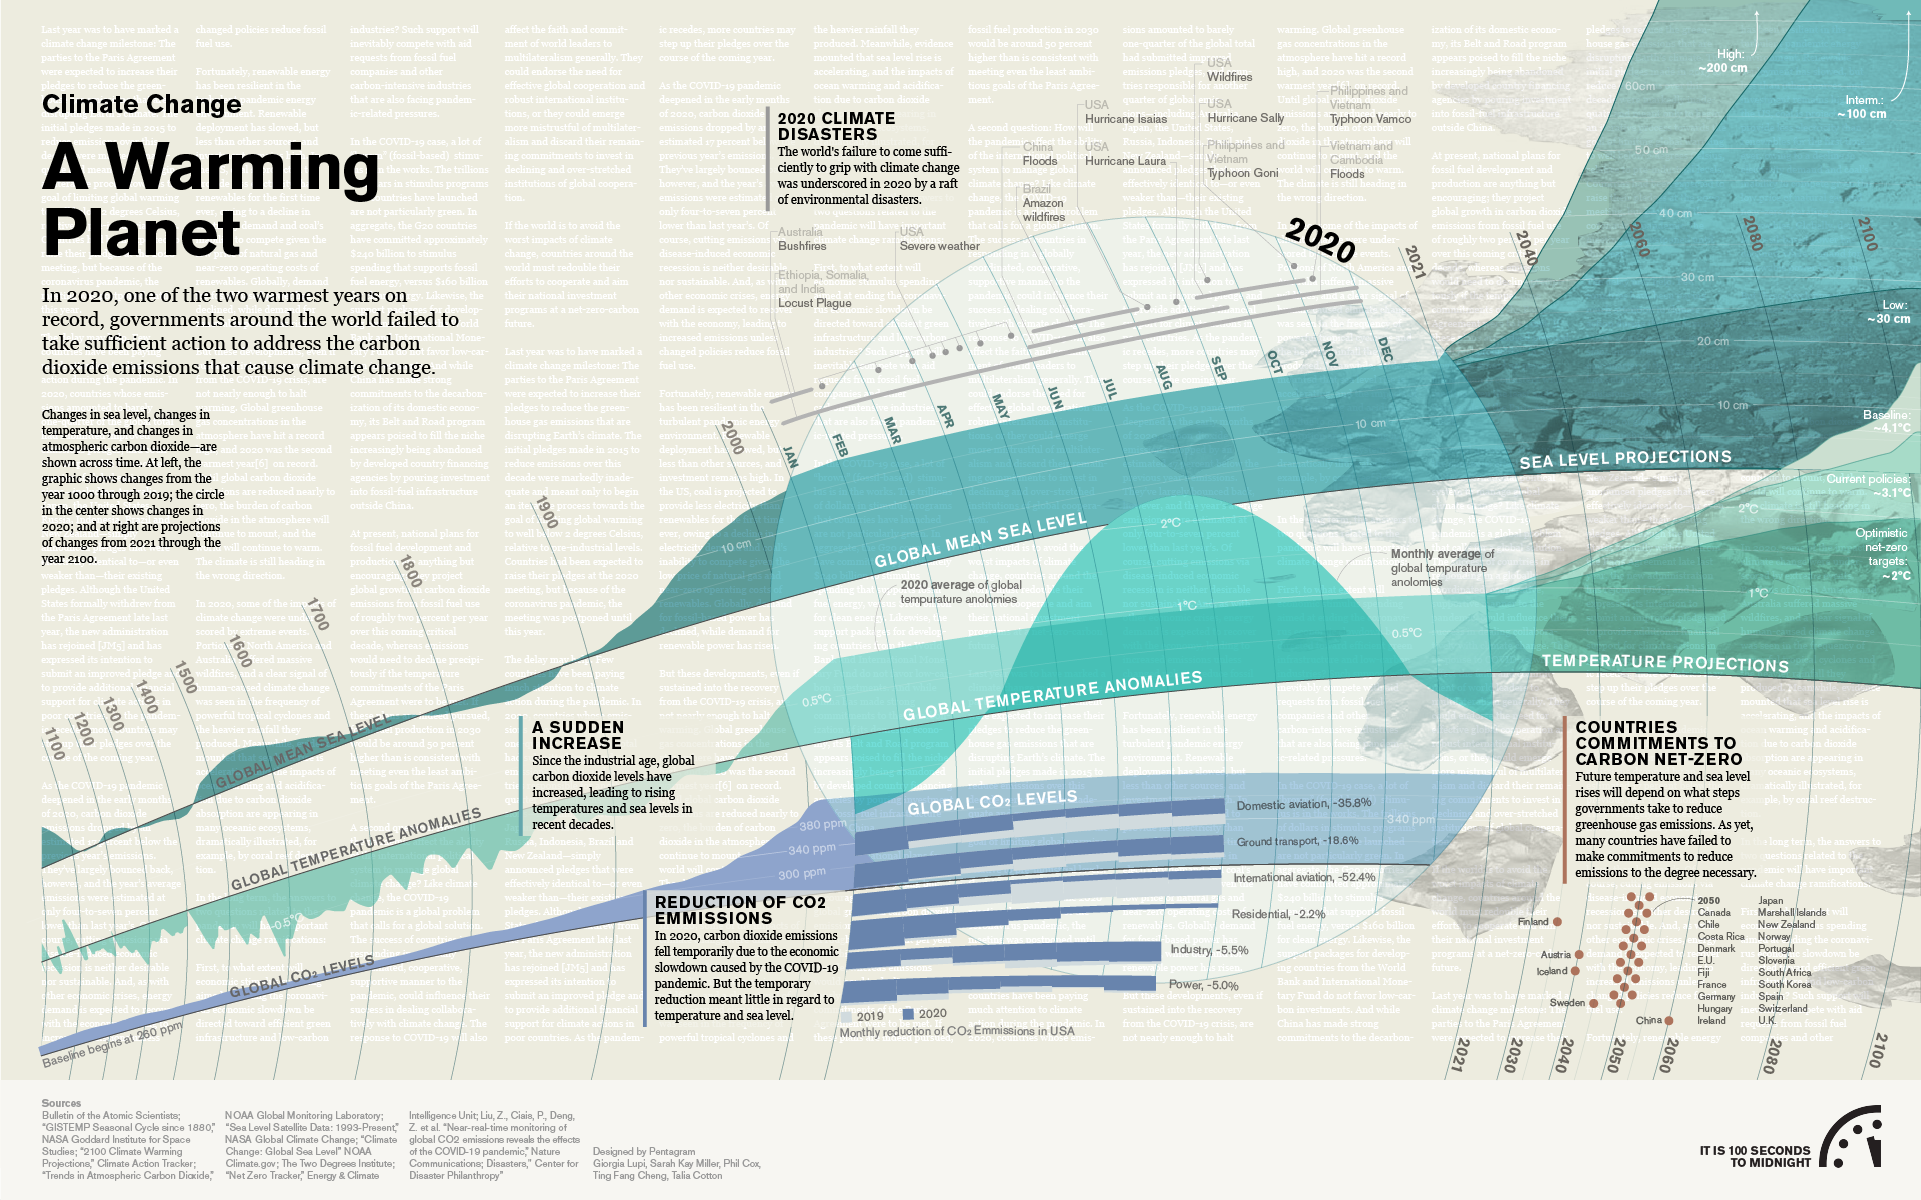
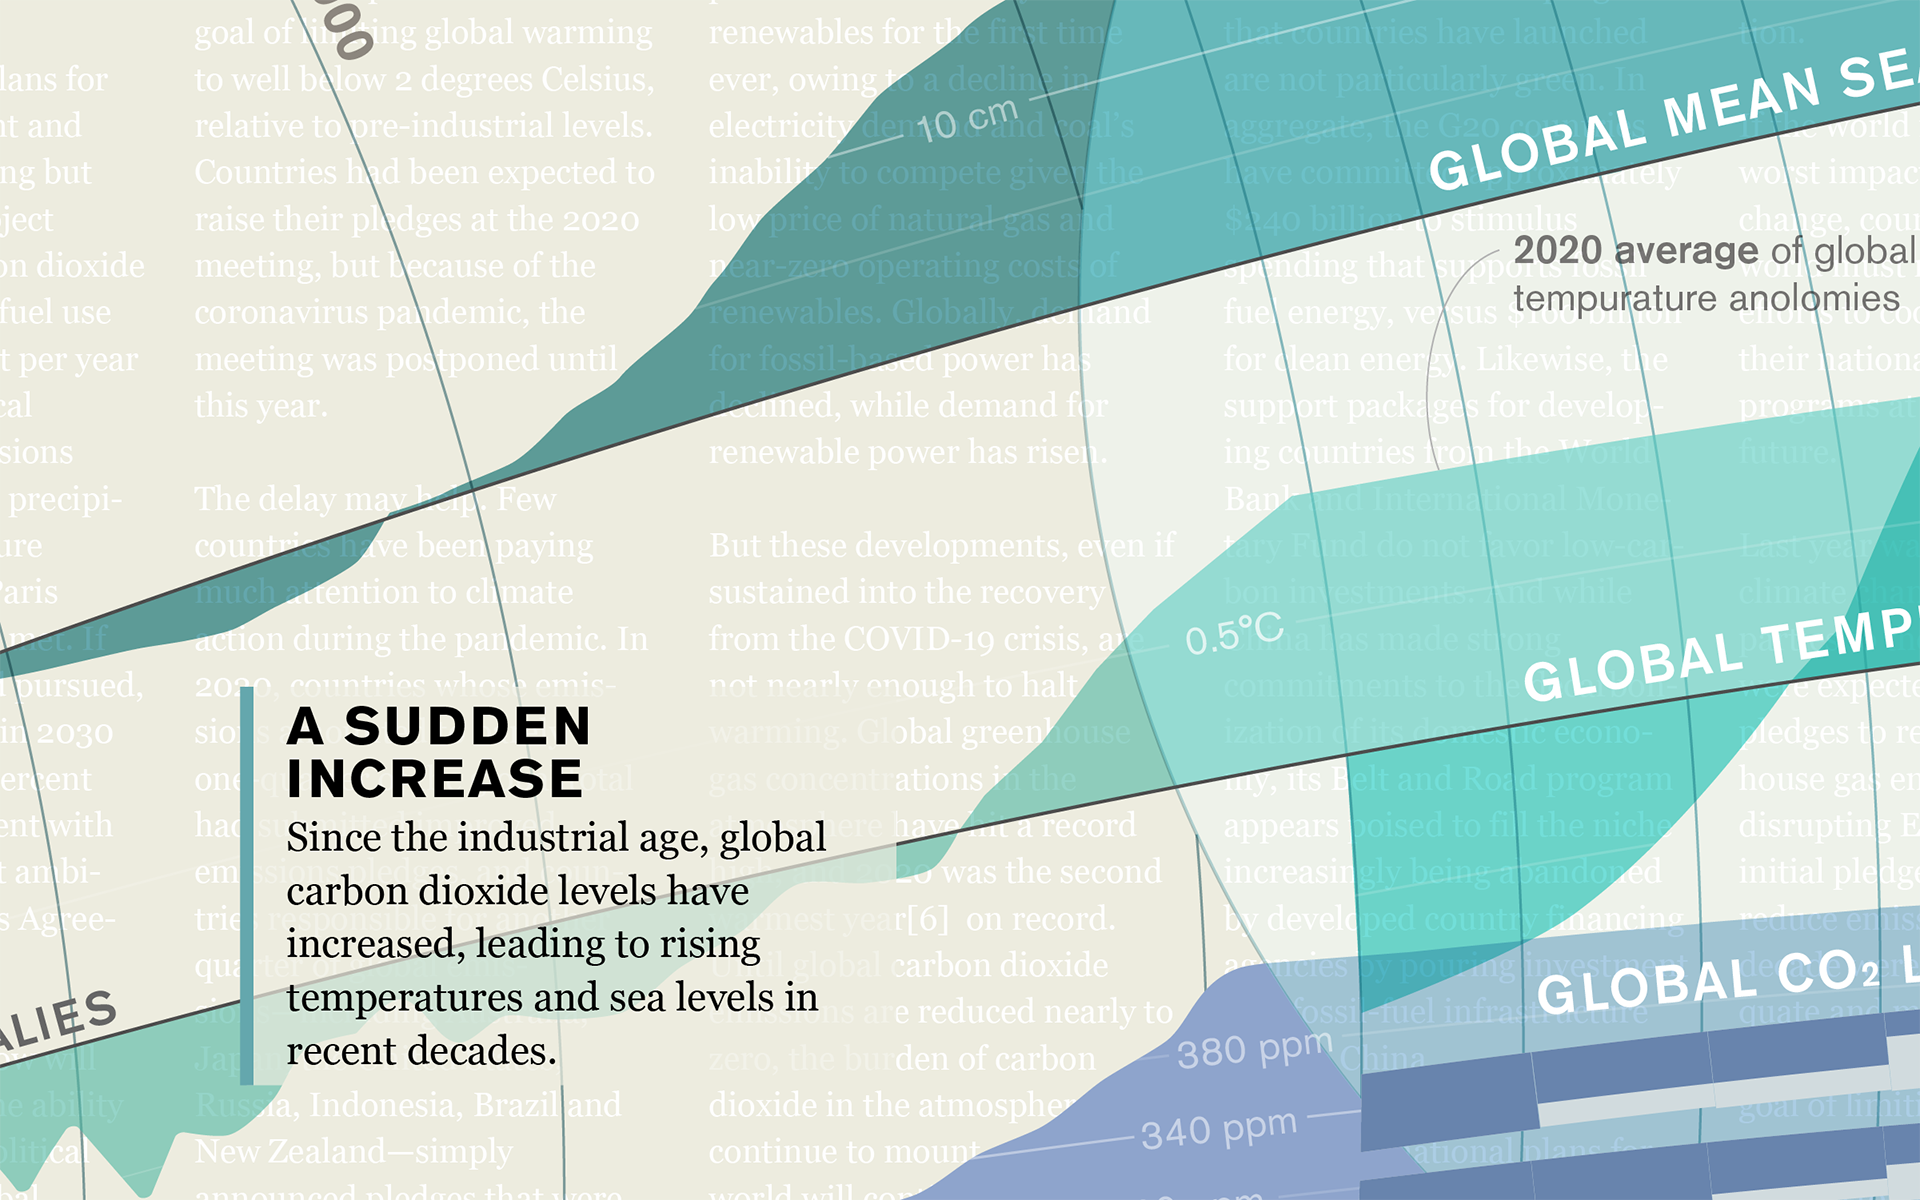
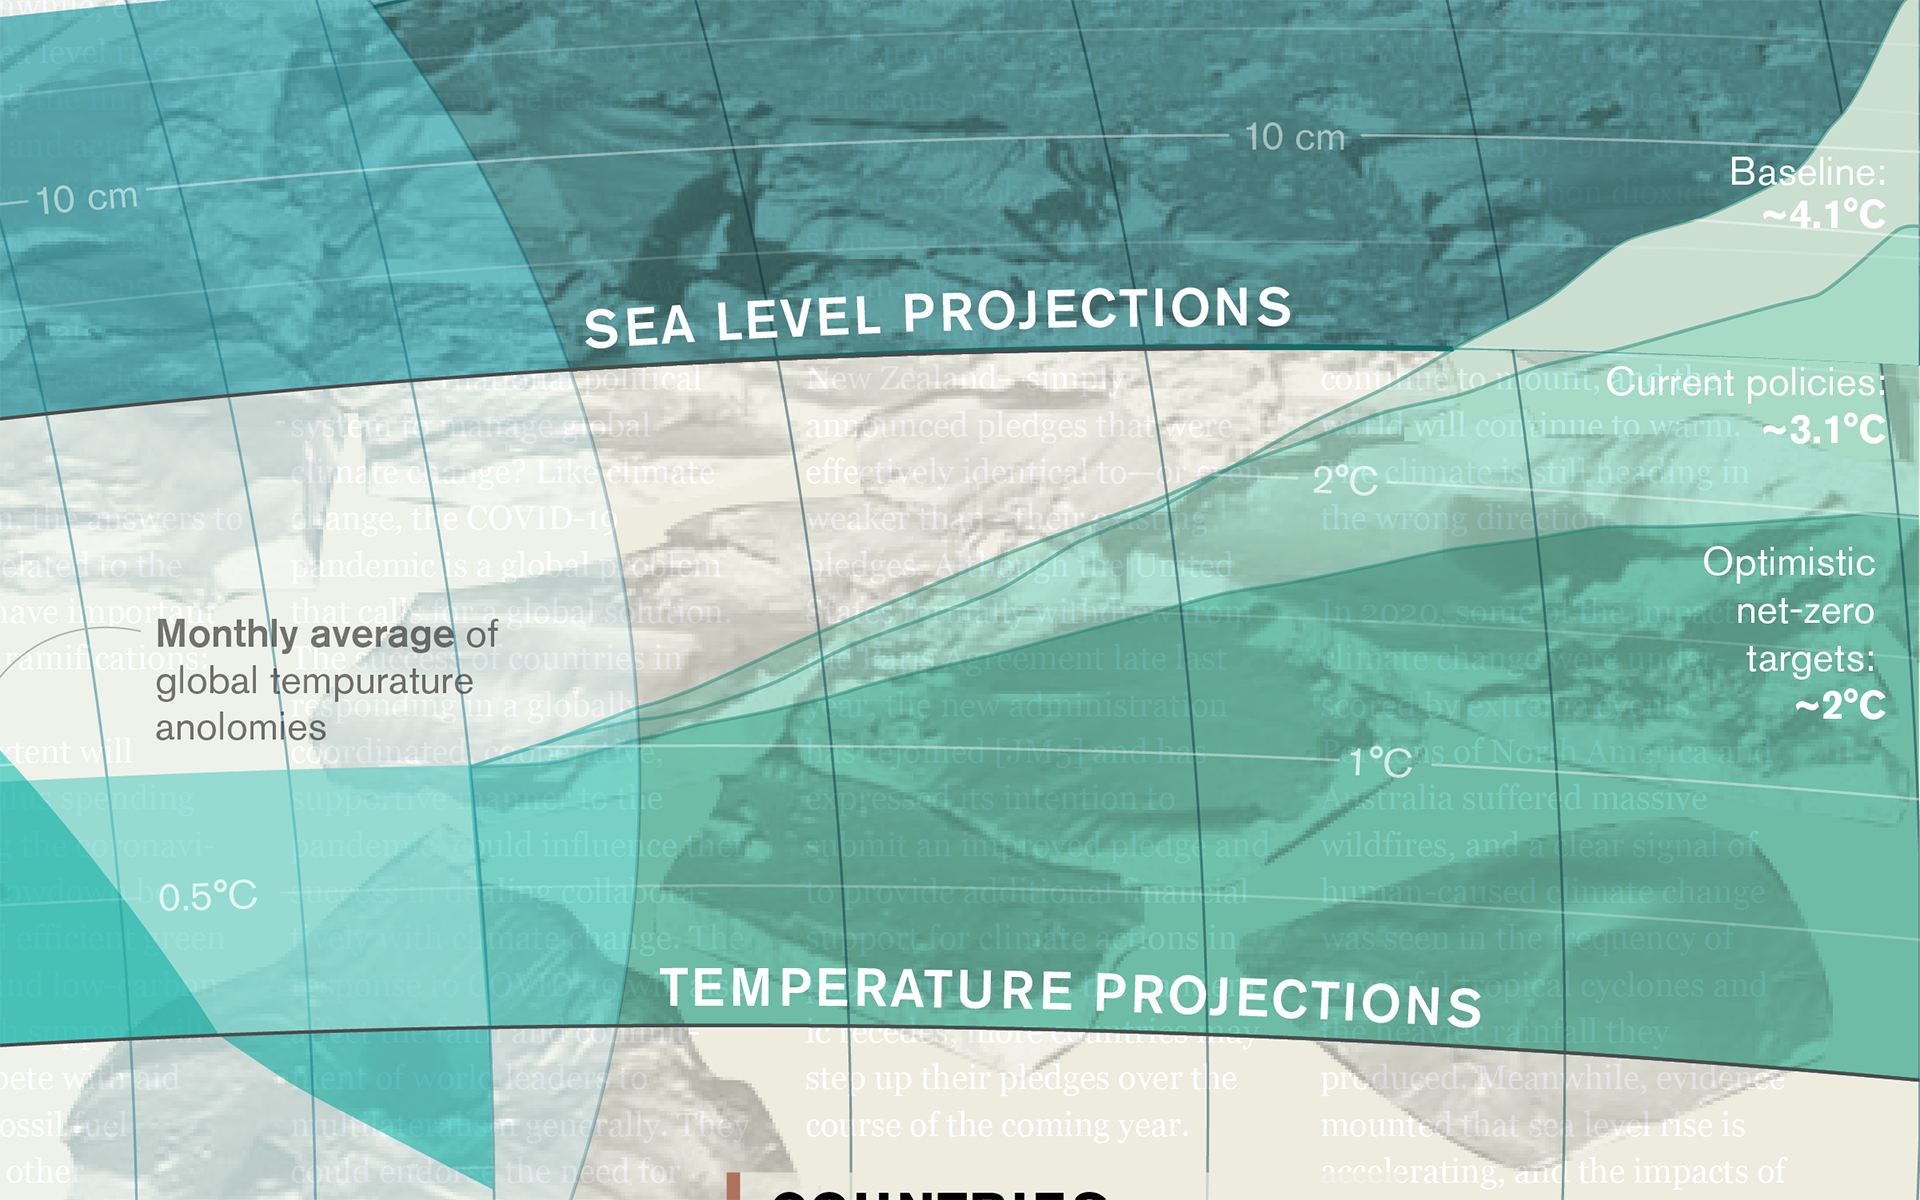
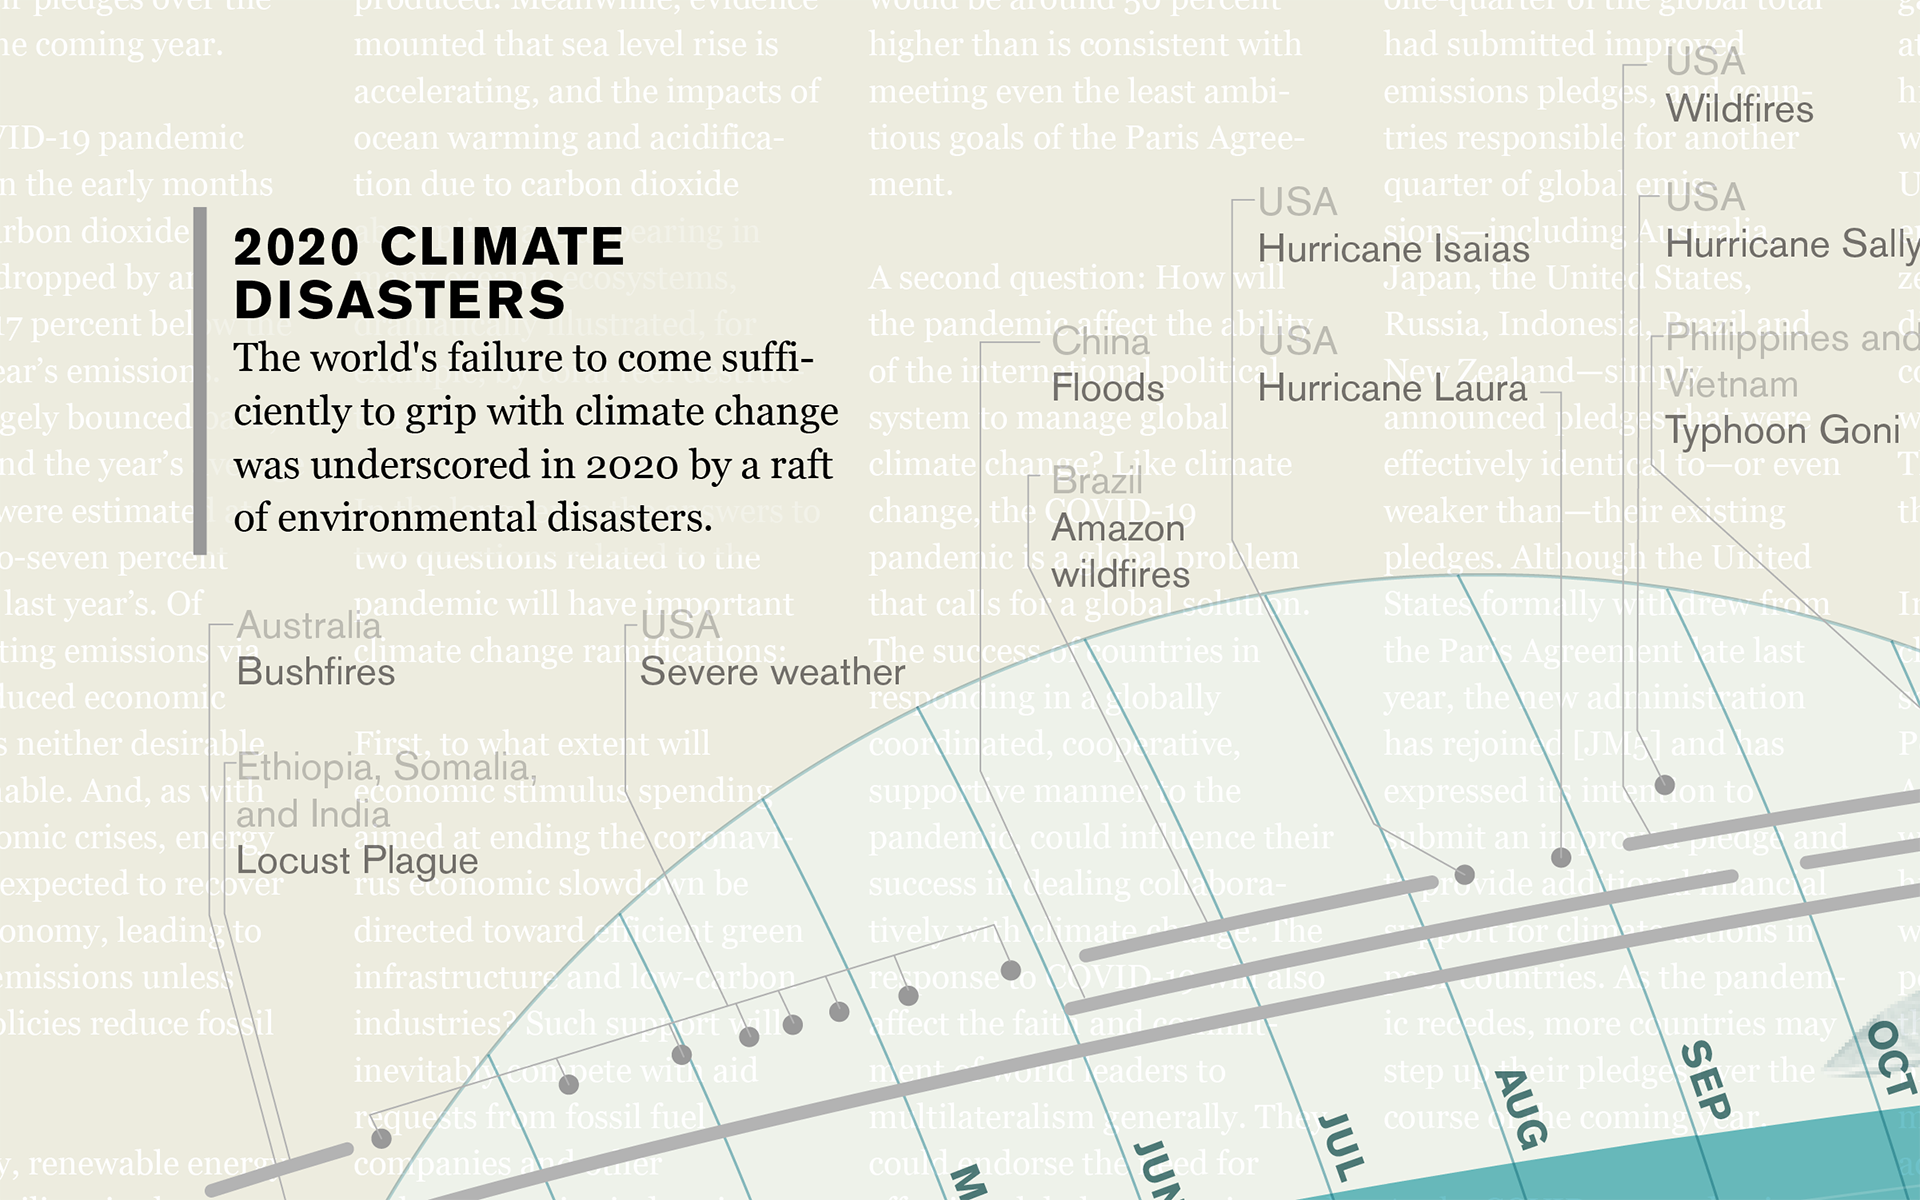
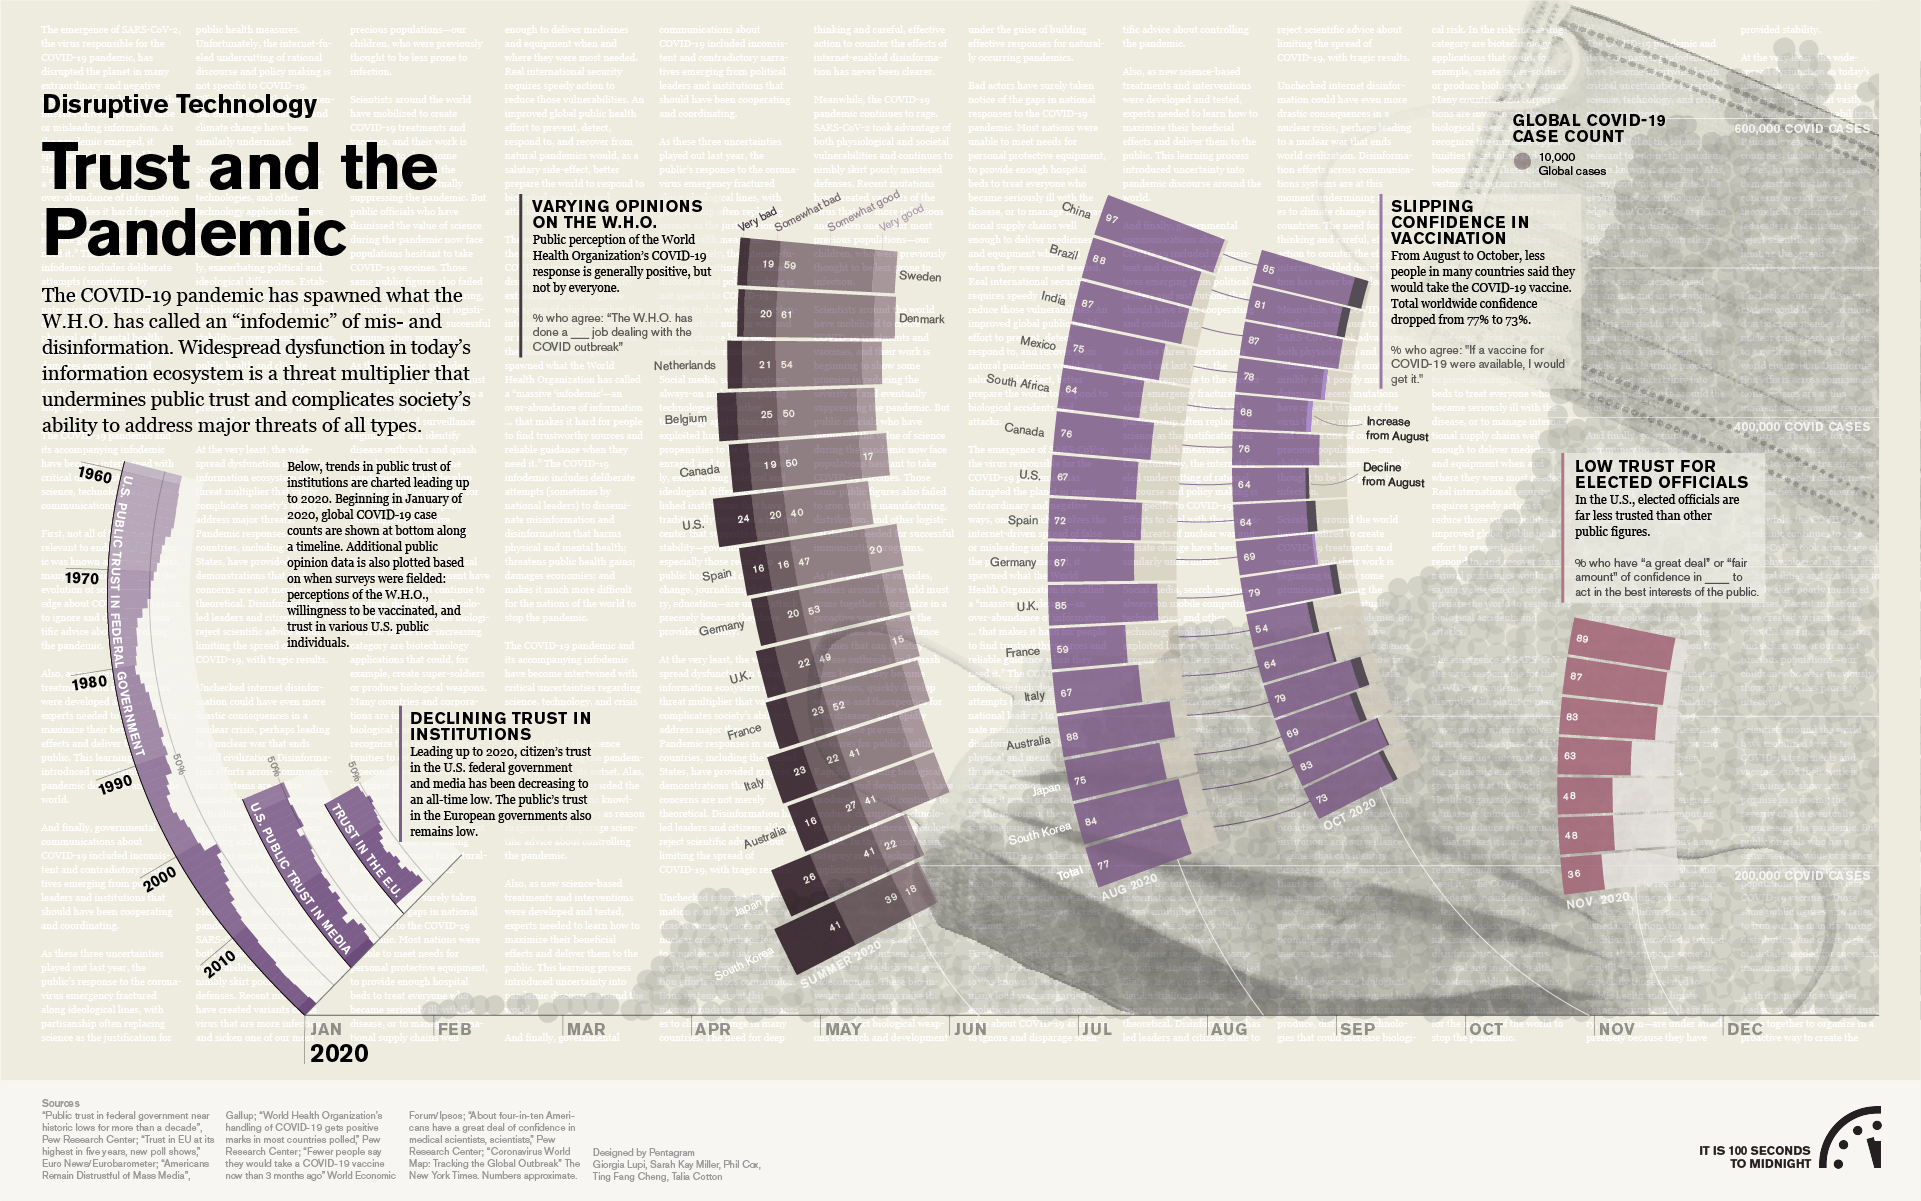
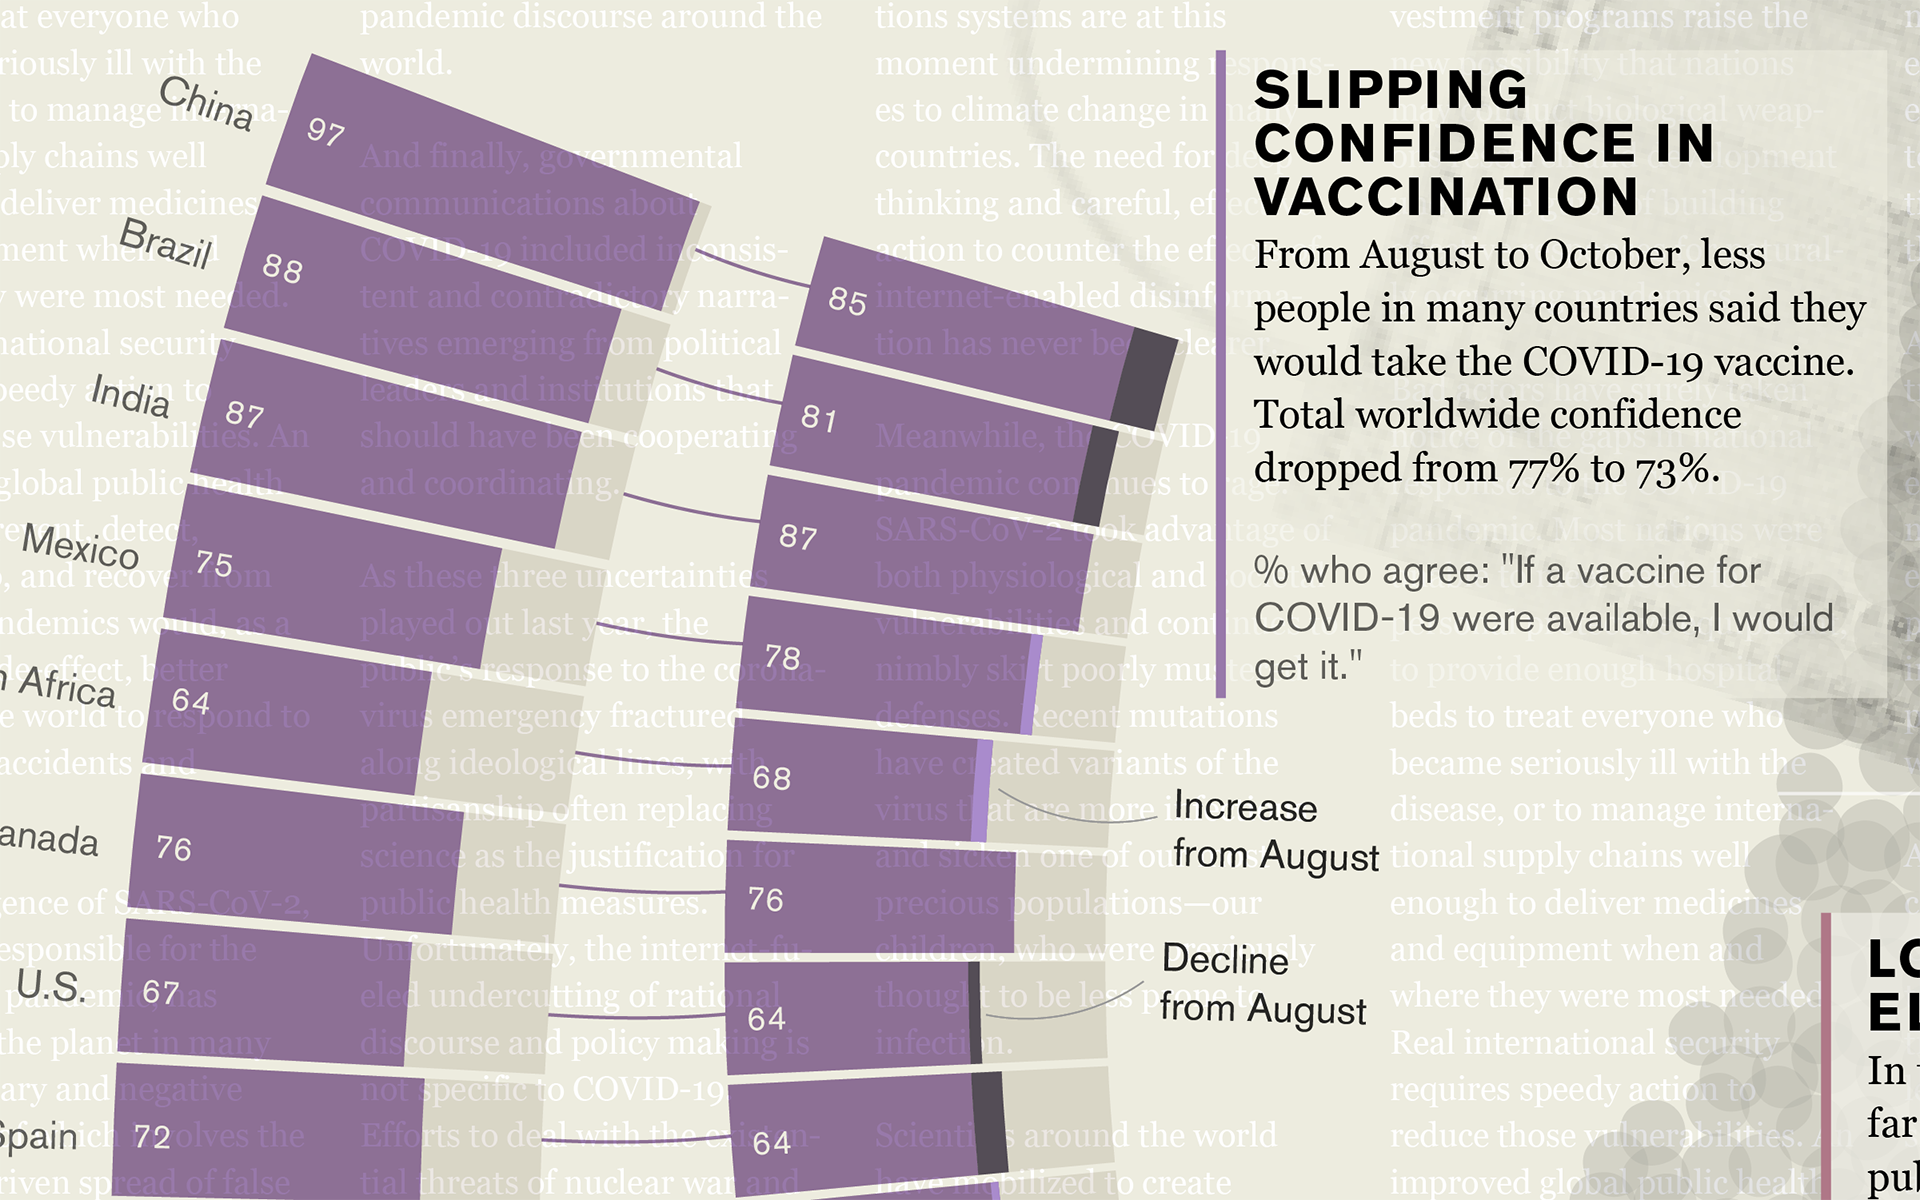
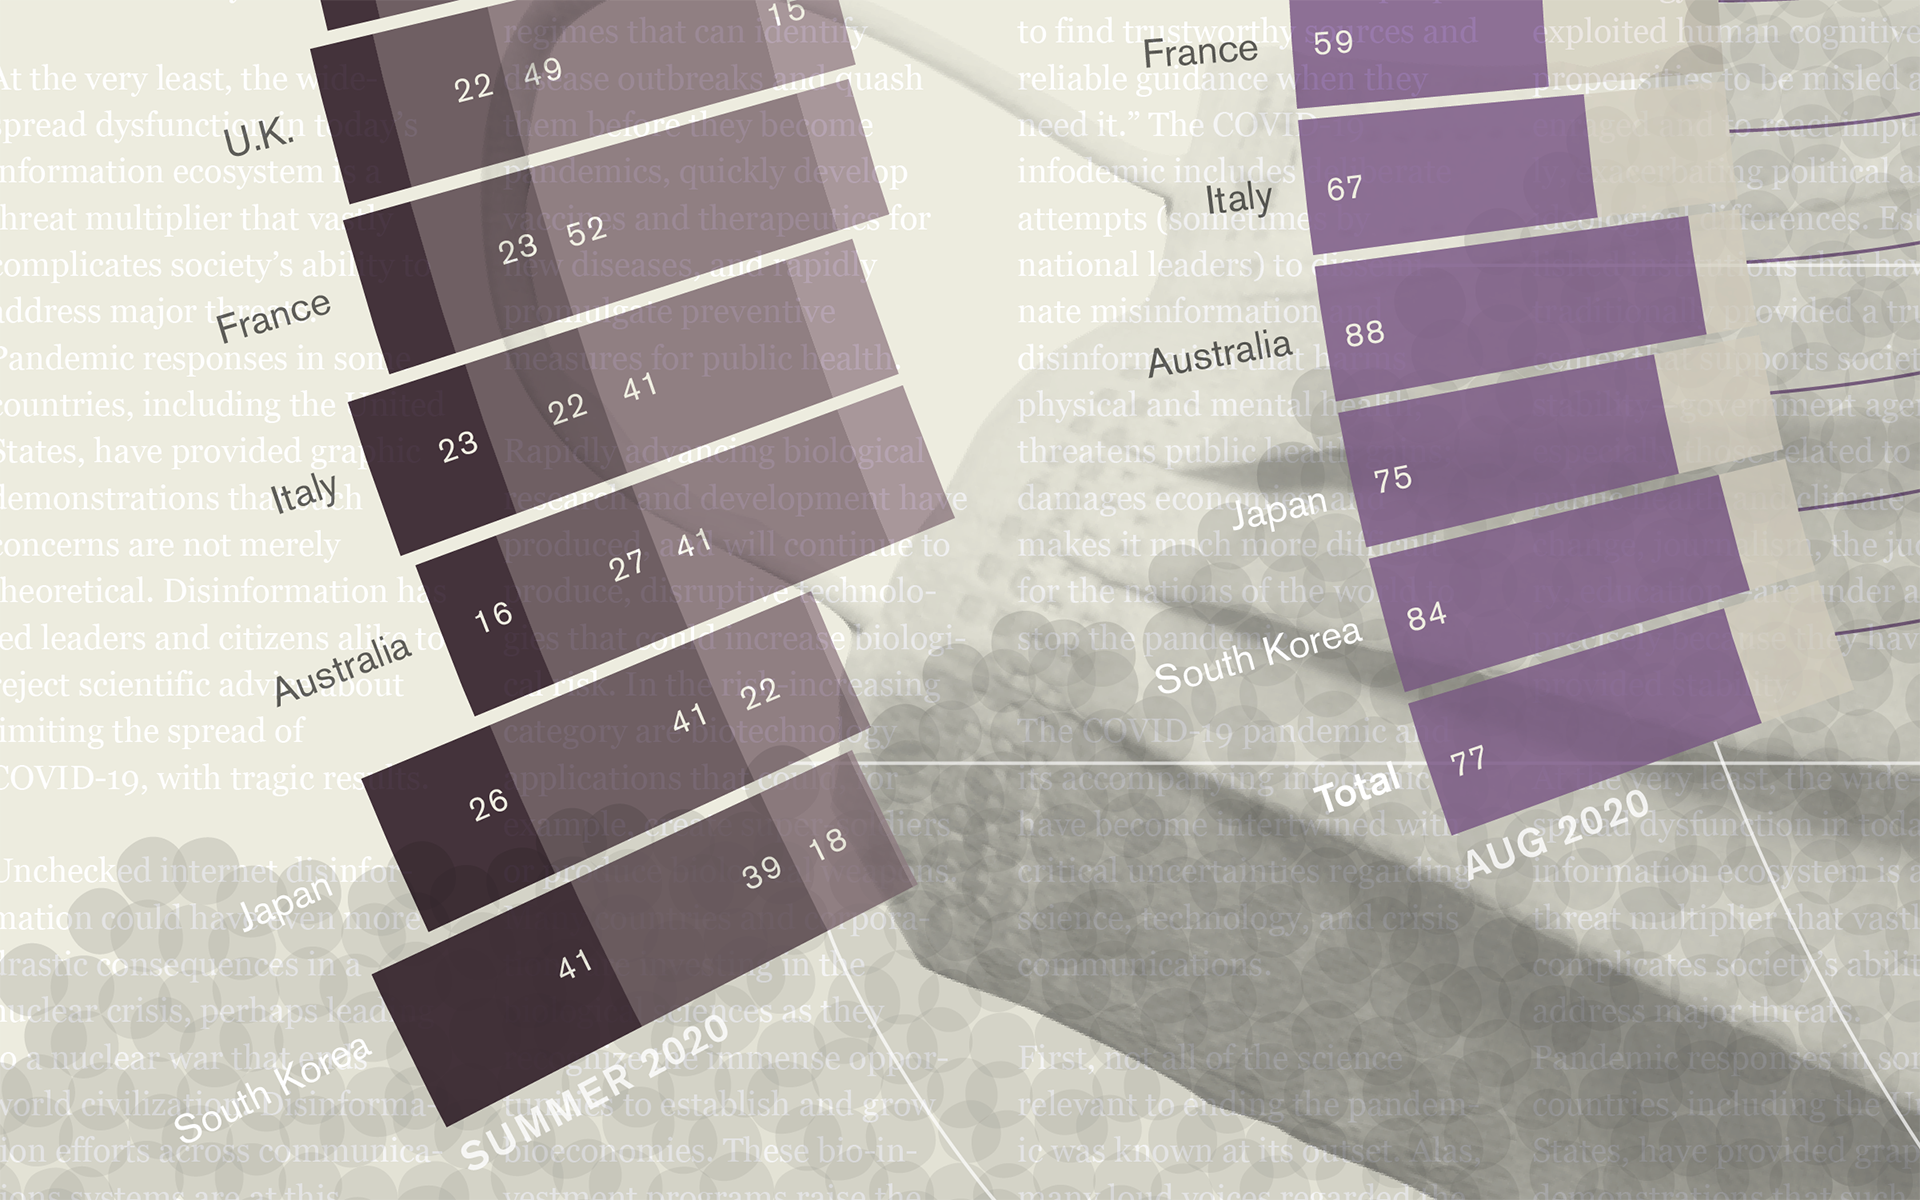
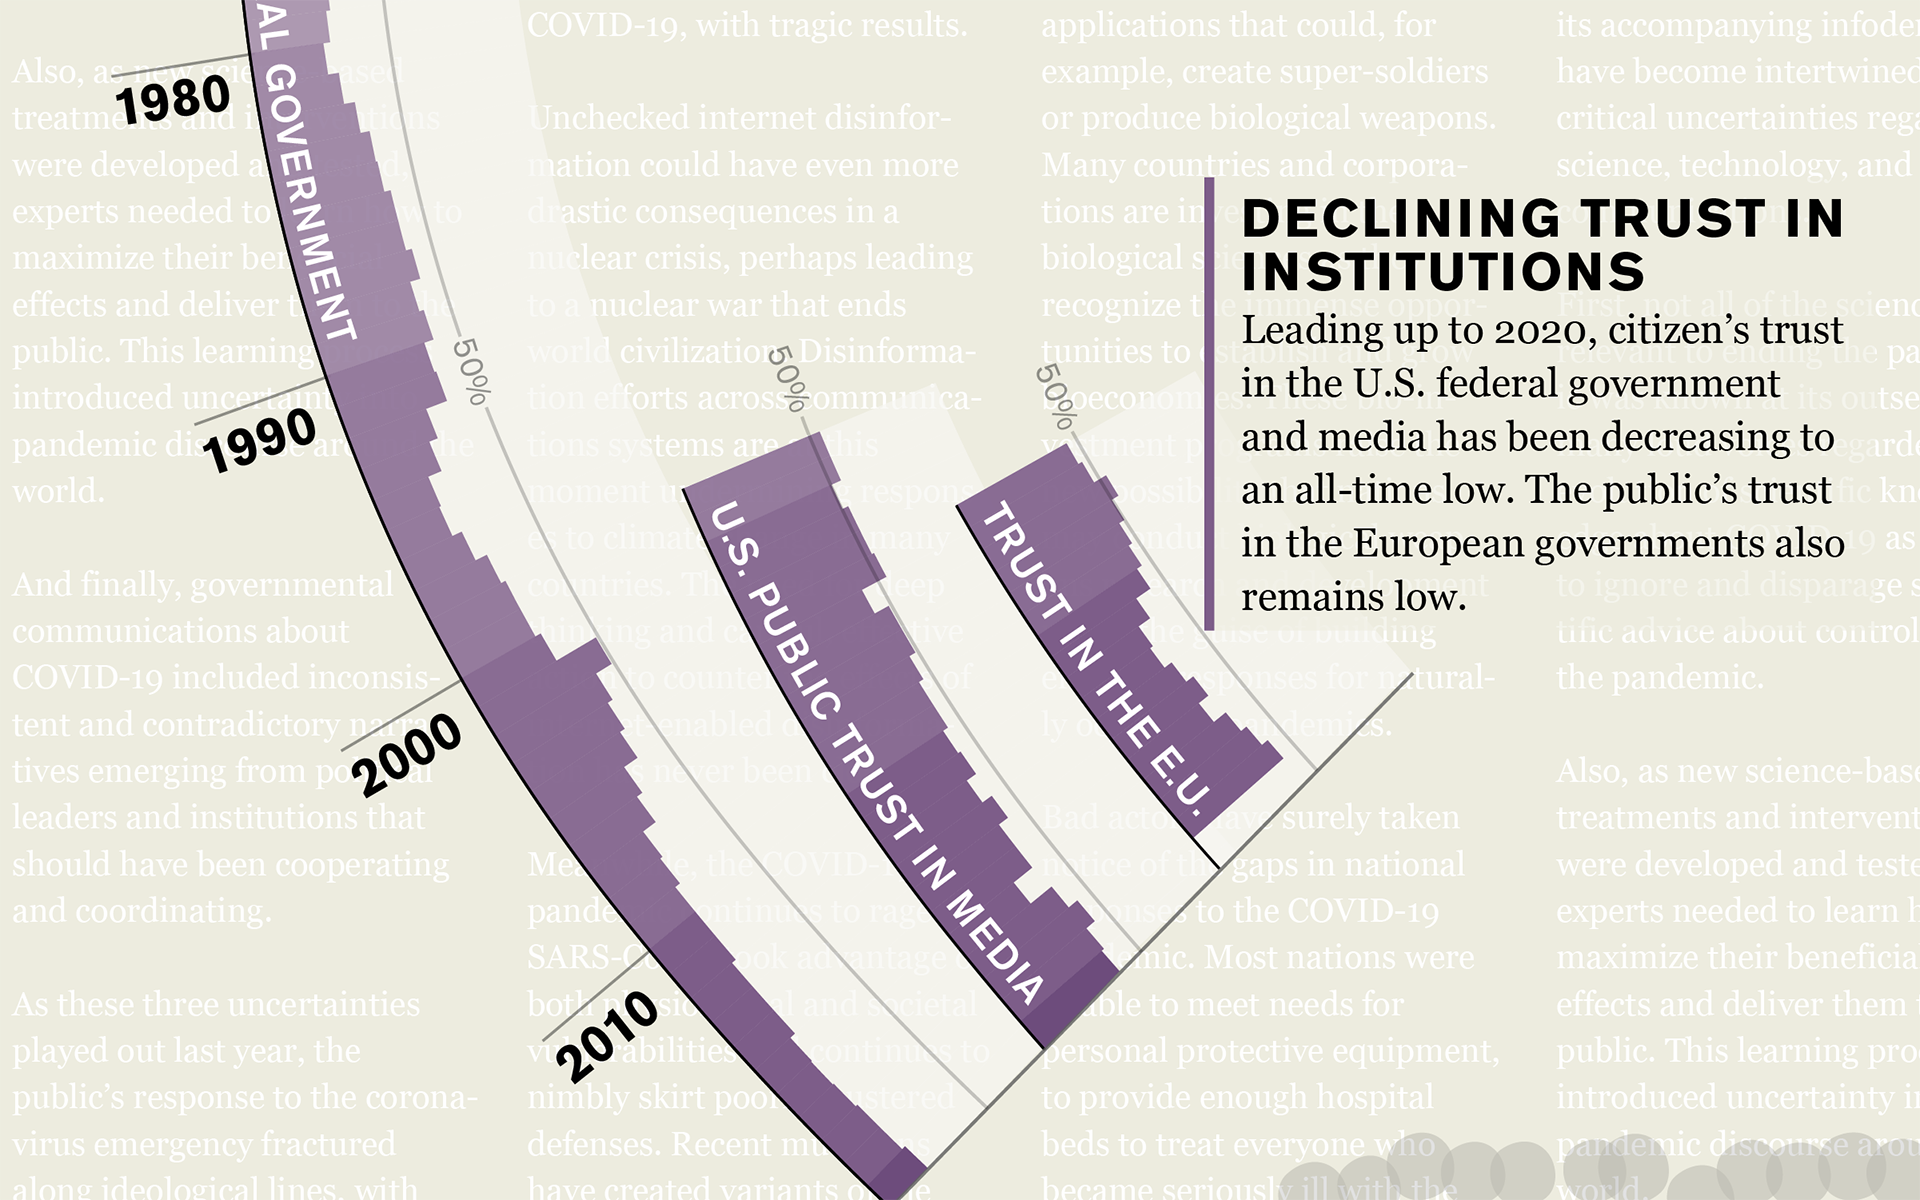
A series of data visualizations offers a detailed look into the information that goes into setting the Doomsday Clock.
This is the first time the report has incorporated additional visual information on the man-made threats to our planet, and the infographics provide a detailed introduction to the issues at hand.
In 2021, the Bulletin has decided to keep the Clock at its current setting of 100 seconds to midnight––where it was moved in 2018 and remains the closest it has been to midnight since 1953––in recognition of the continuing threat to humanity from nuclear war, climate change, and disinformation.
The dense visualizations have been layered with qualitative and quantitative data that provide depth of detail and build a comprehensive narrative of the issue and its impact on the world.