Happy Data
Data Visualization / 2020
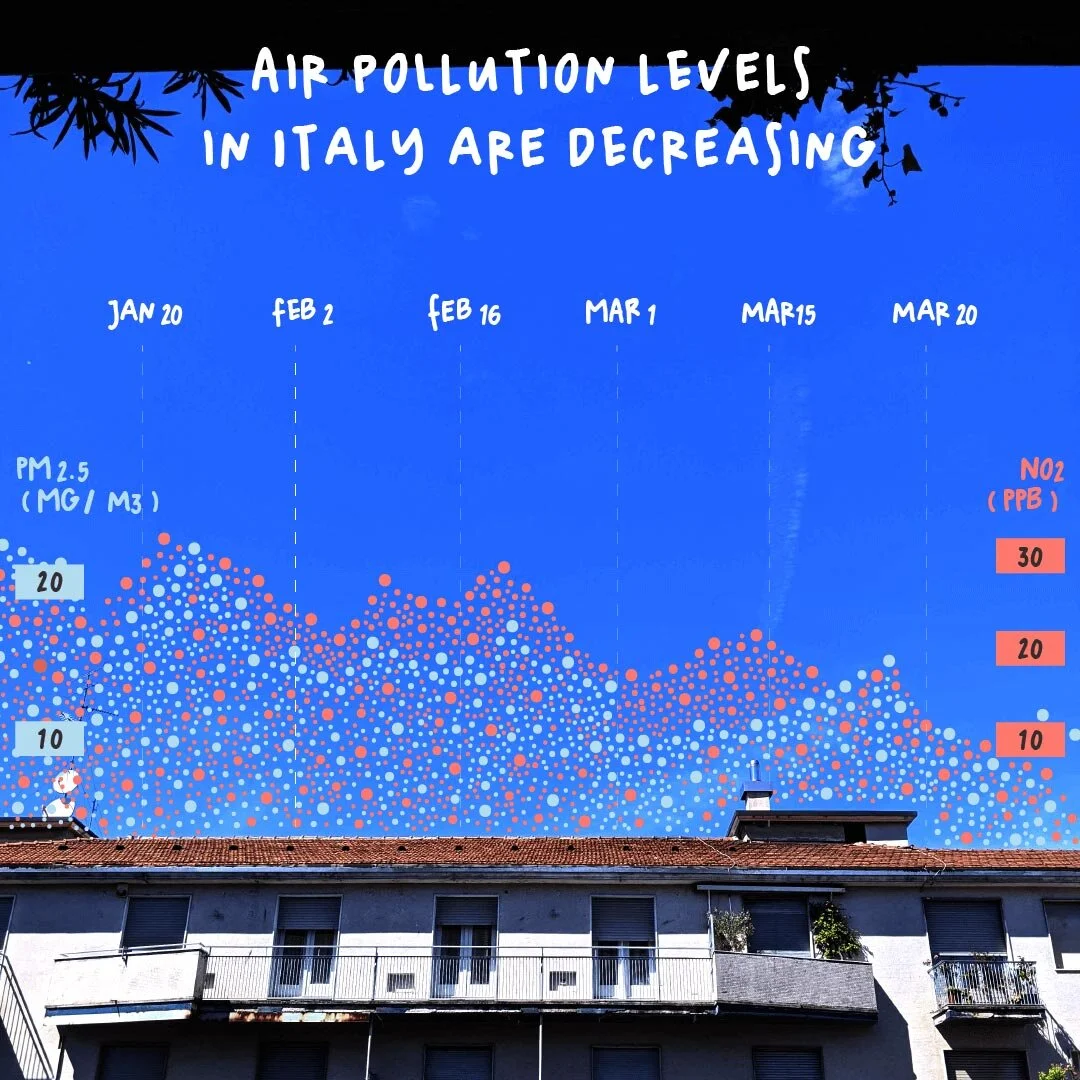
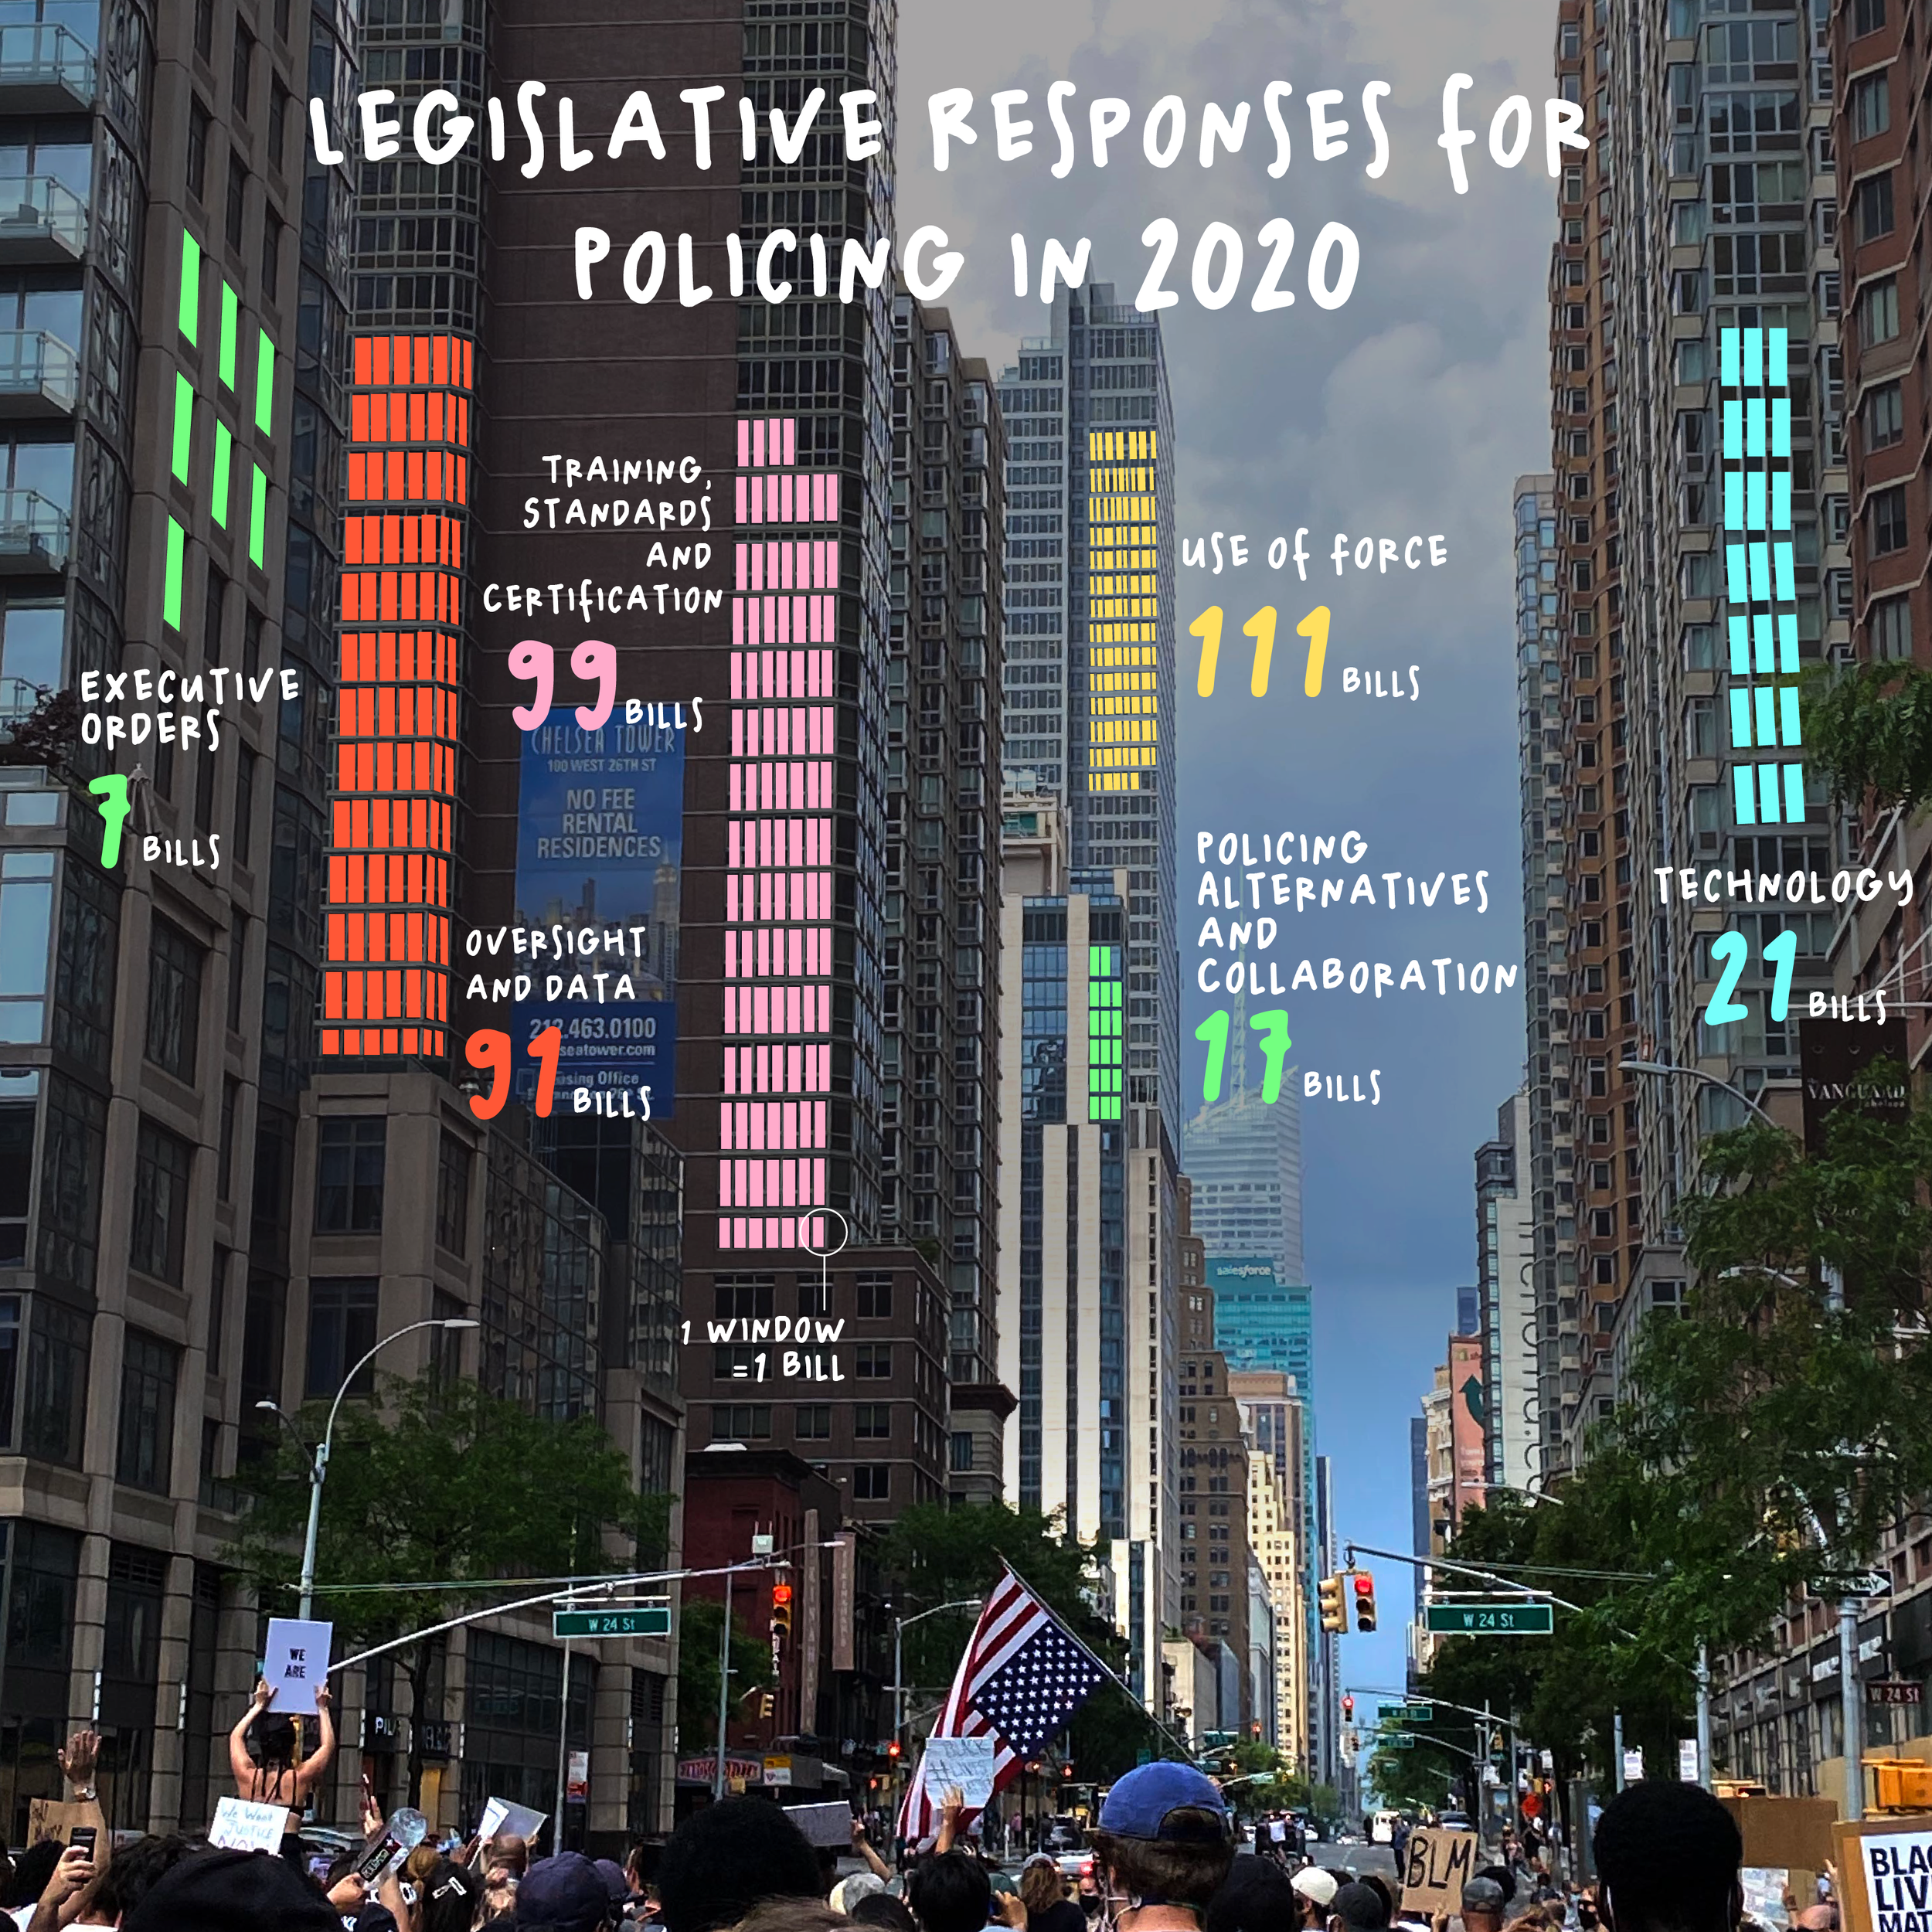
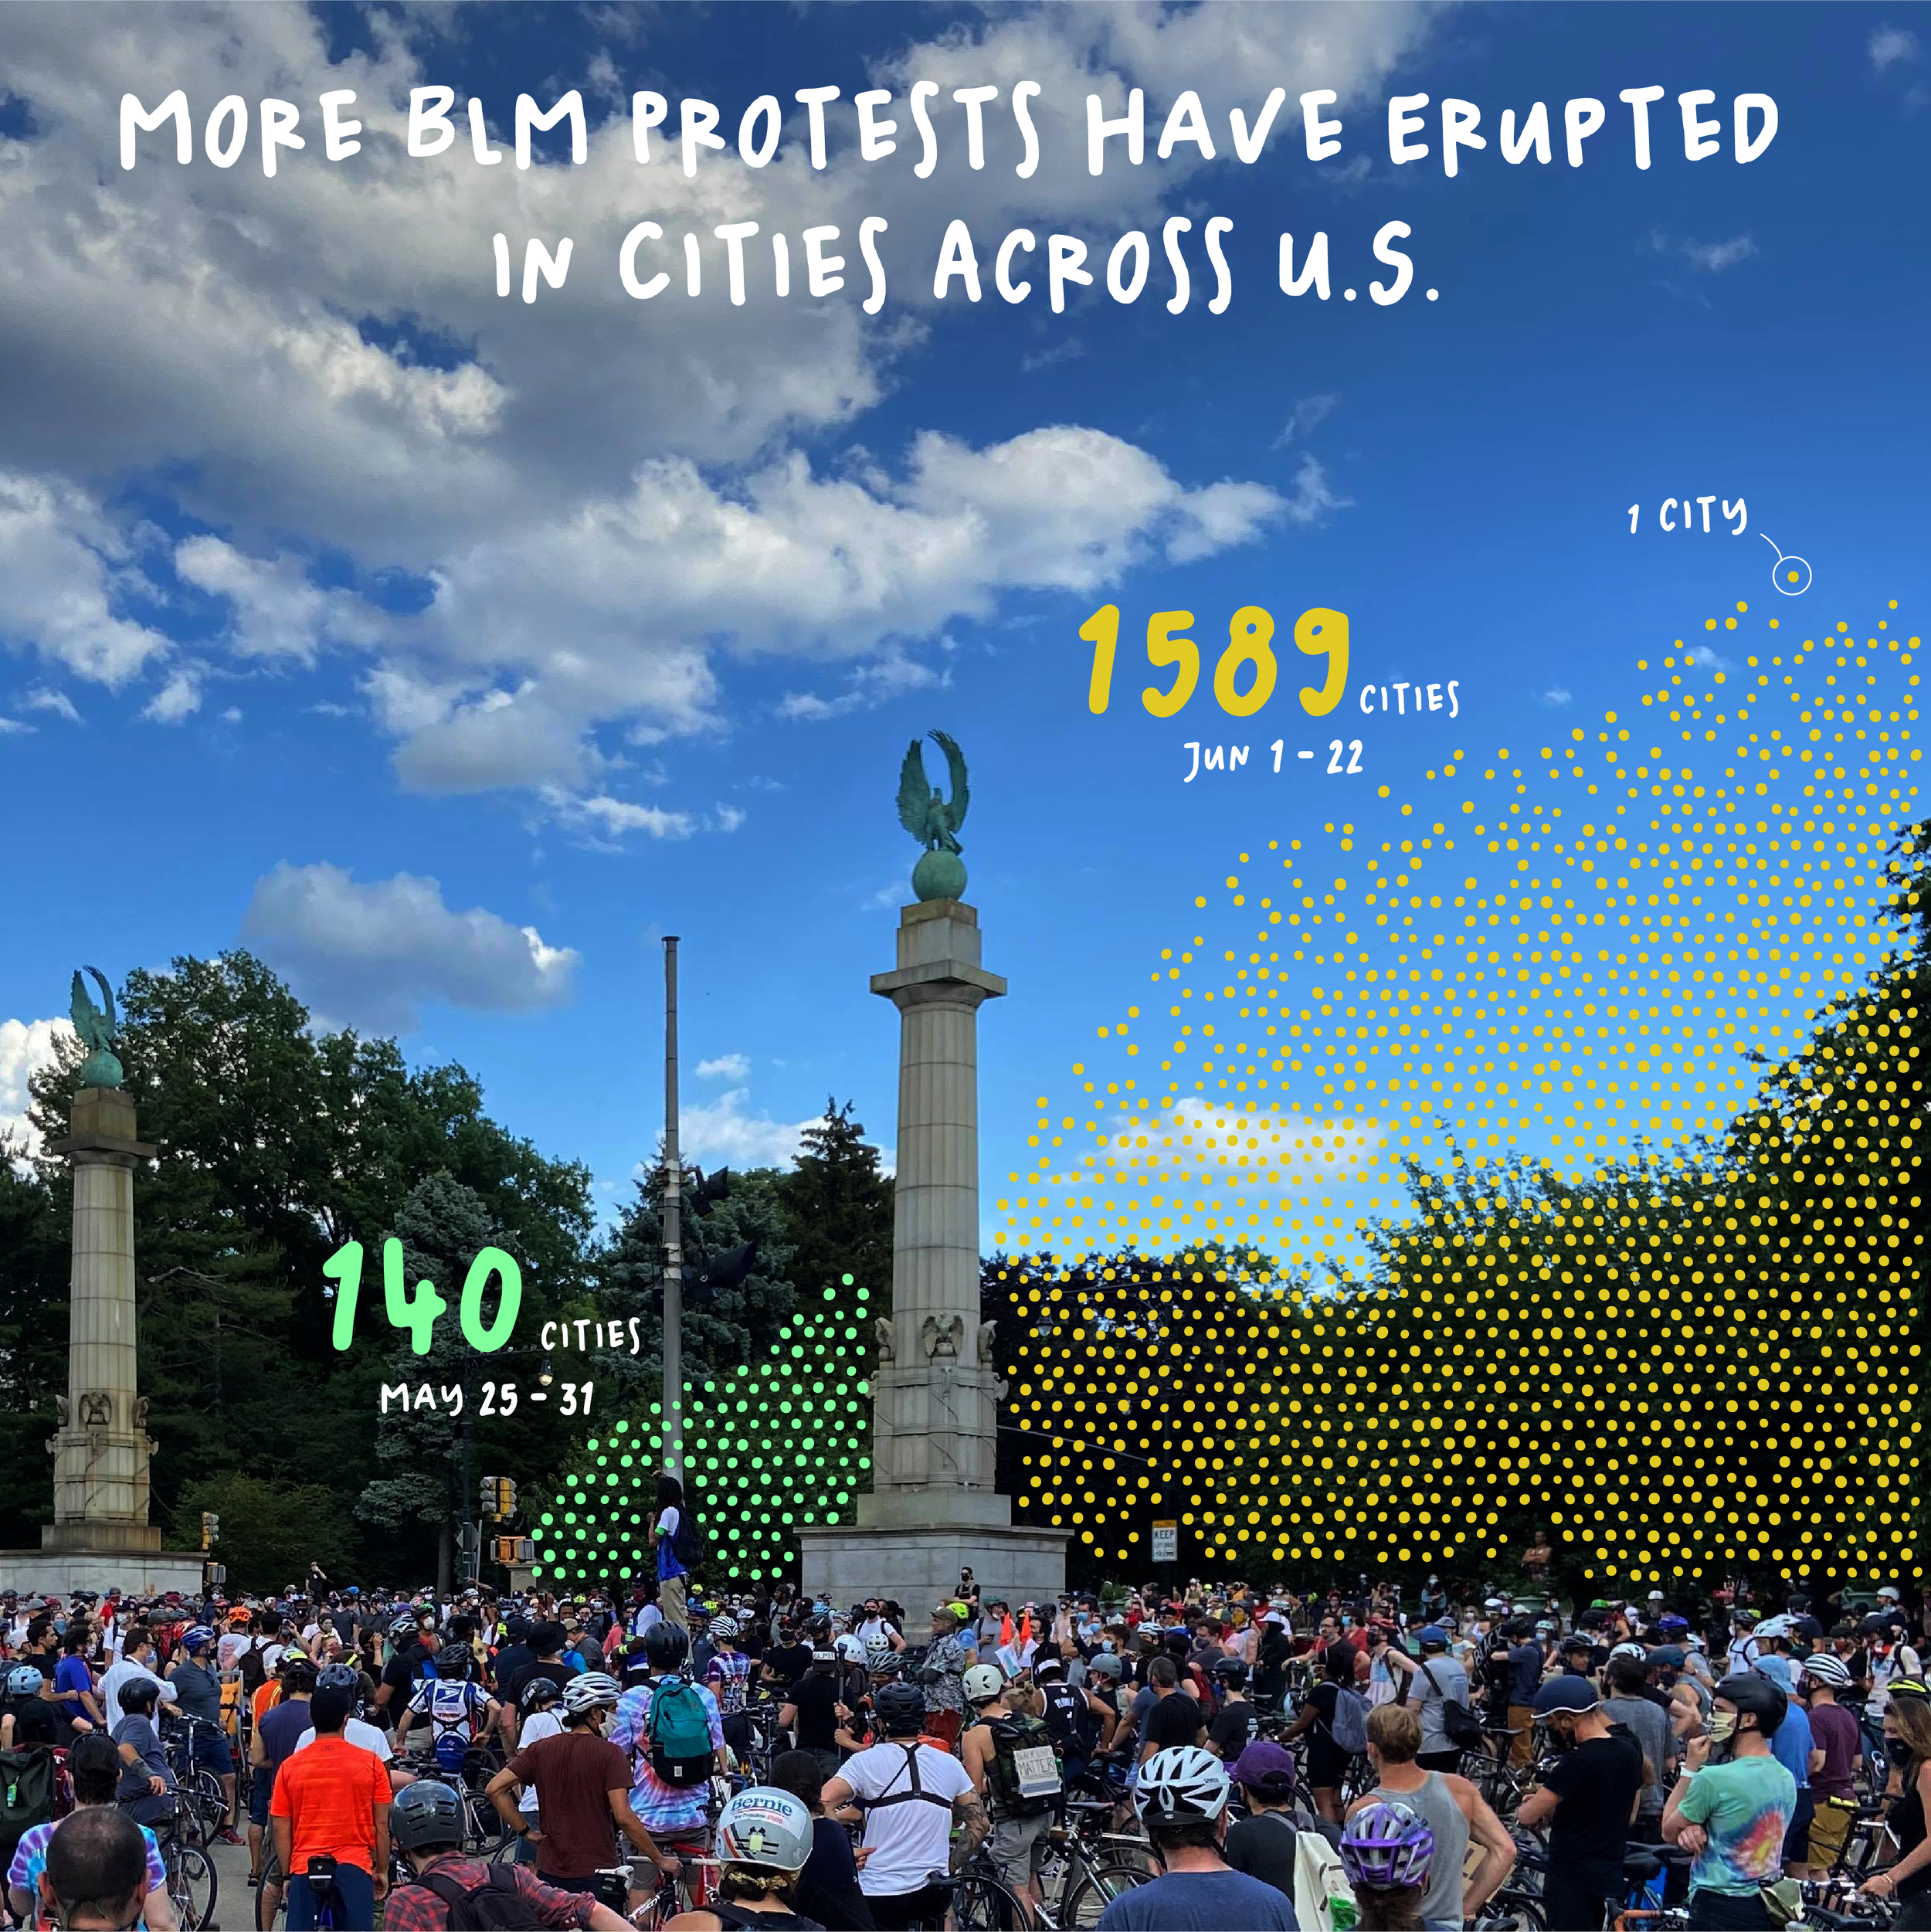
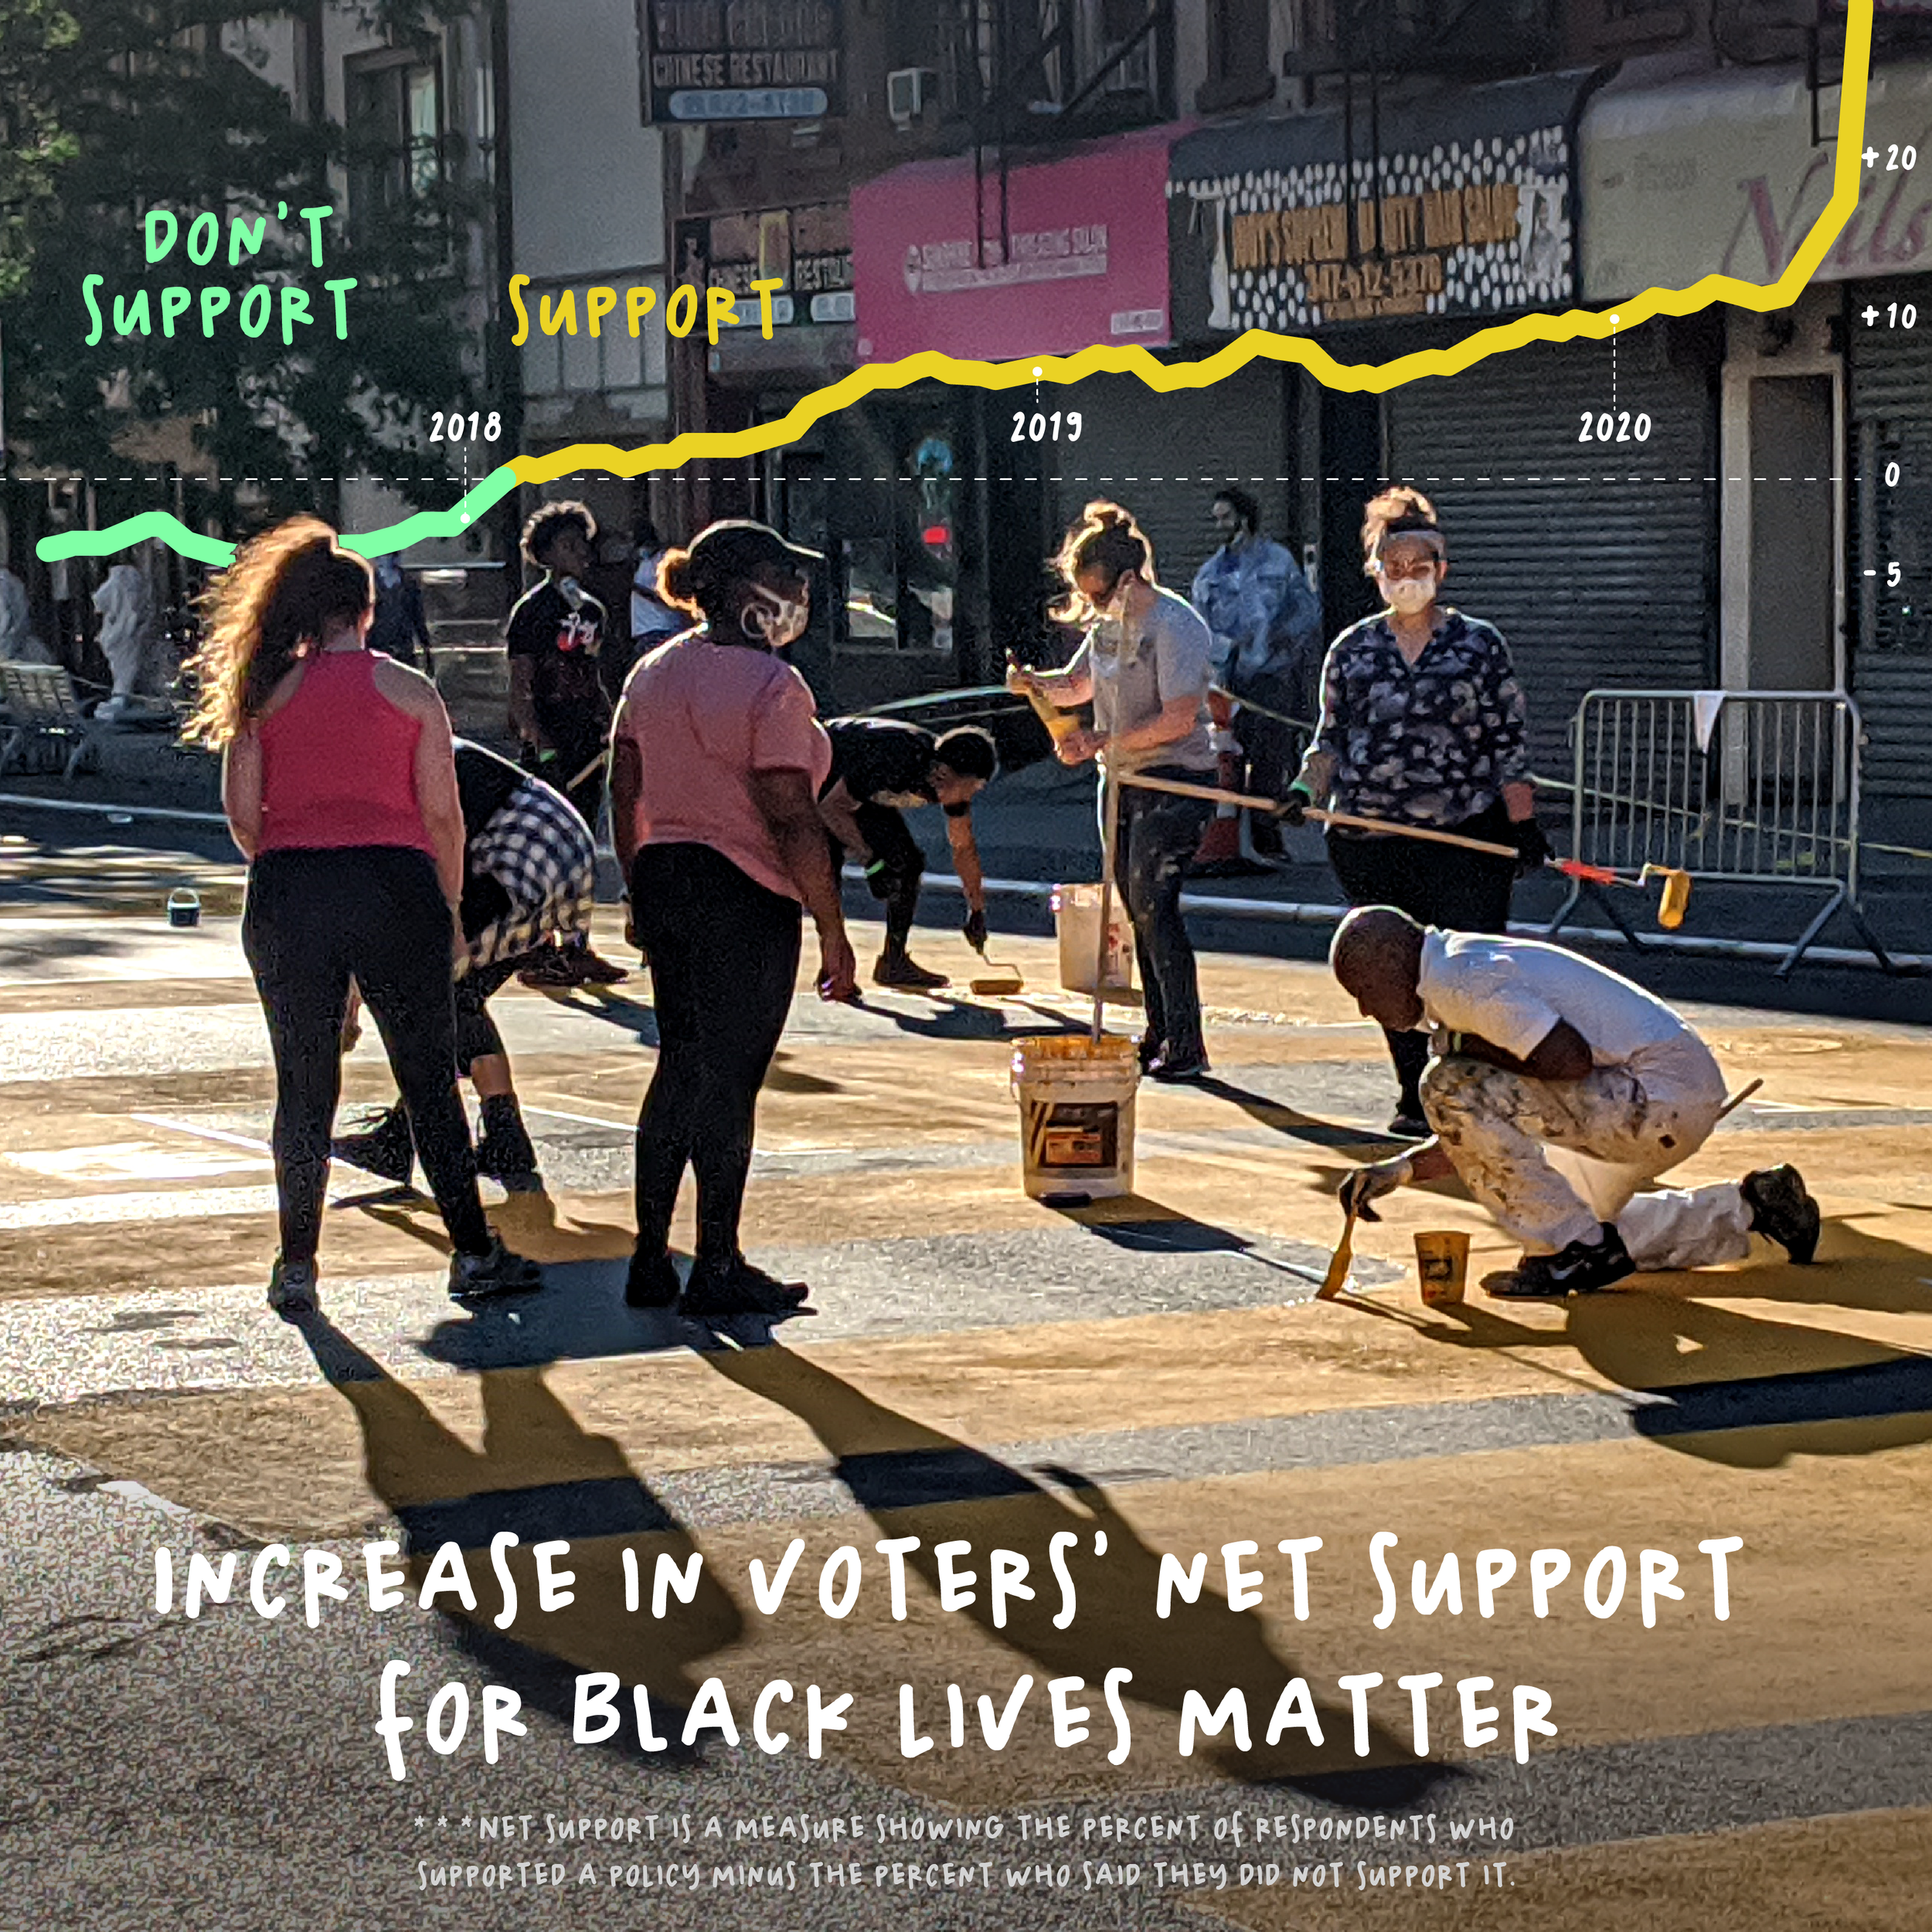
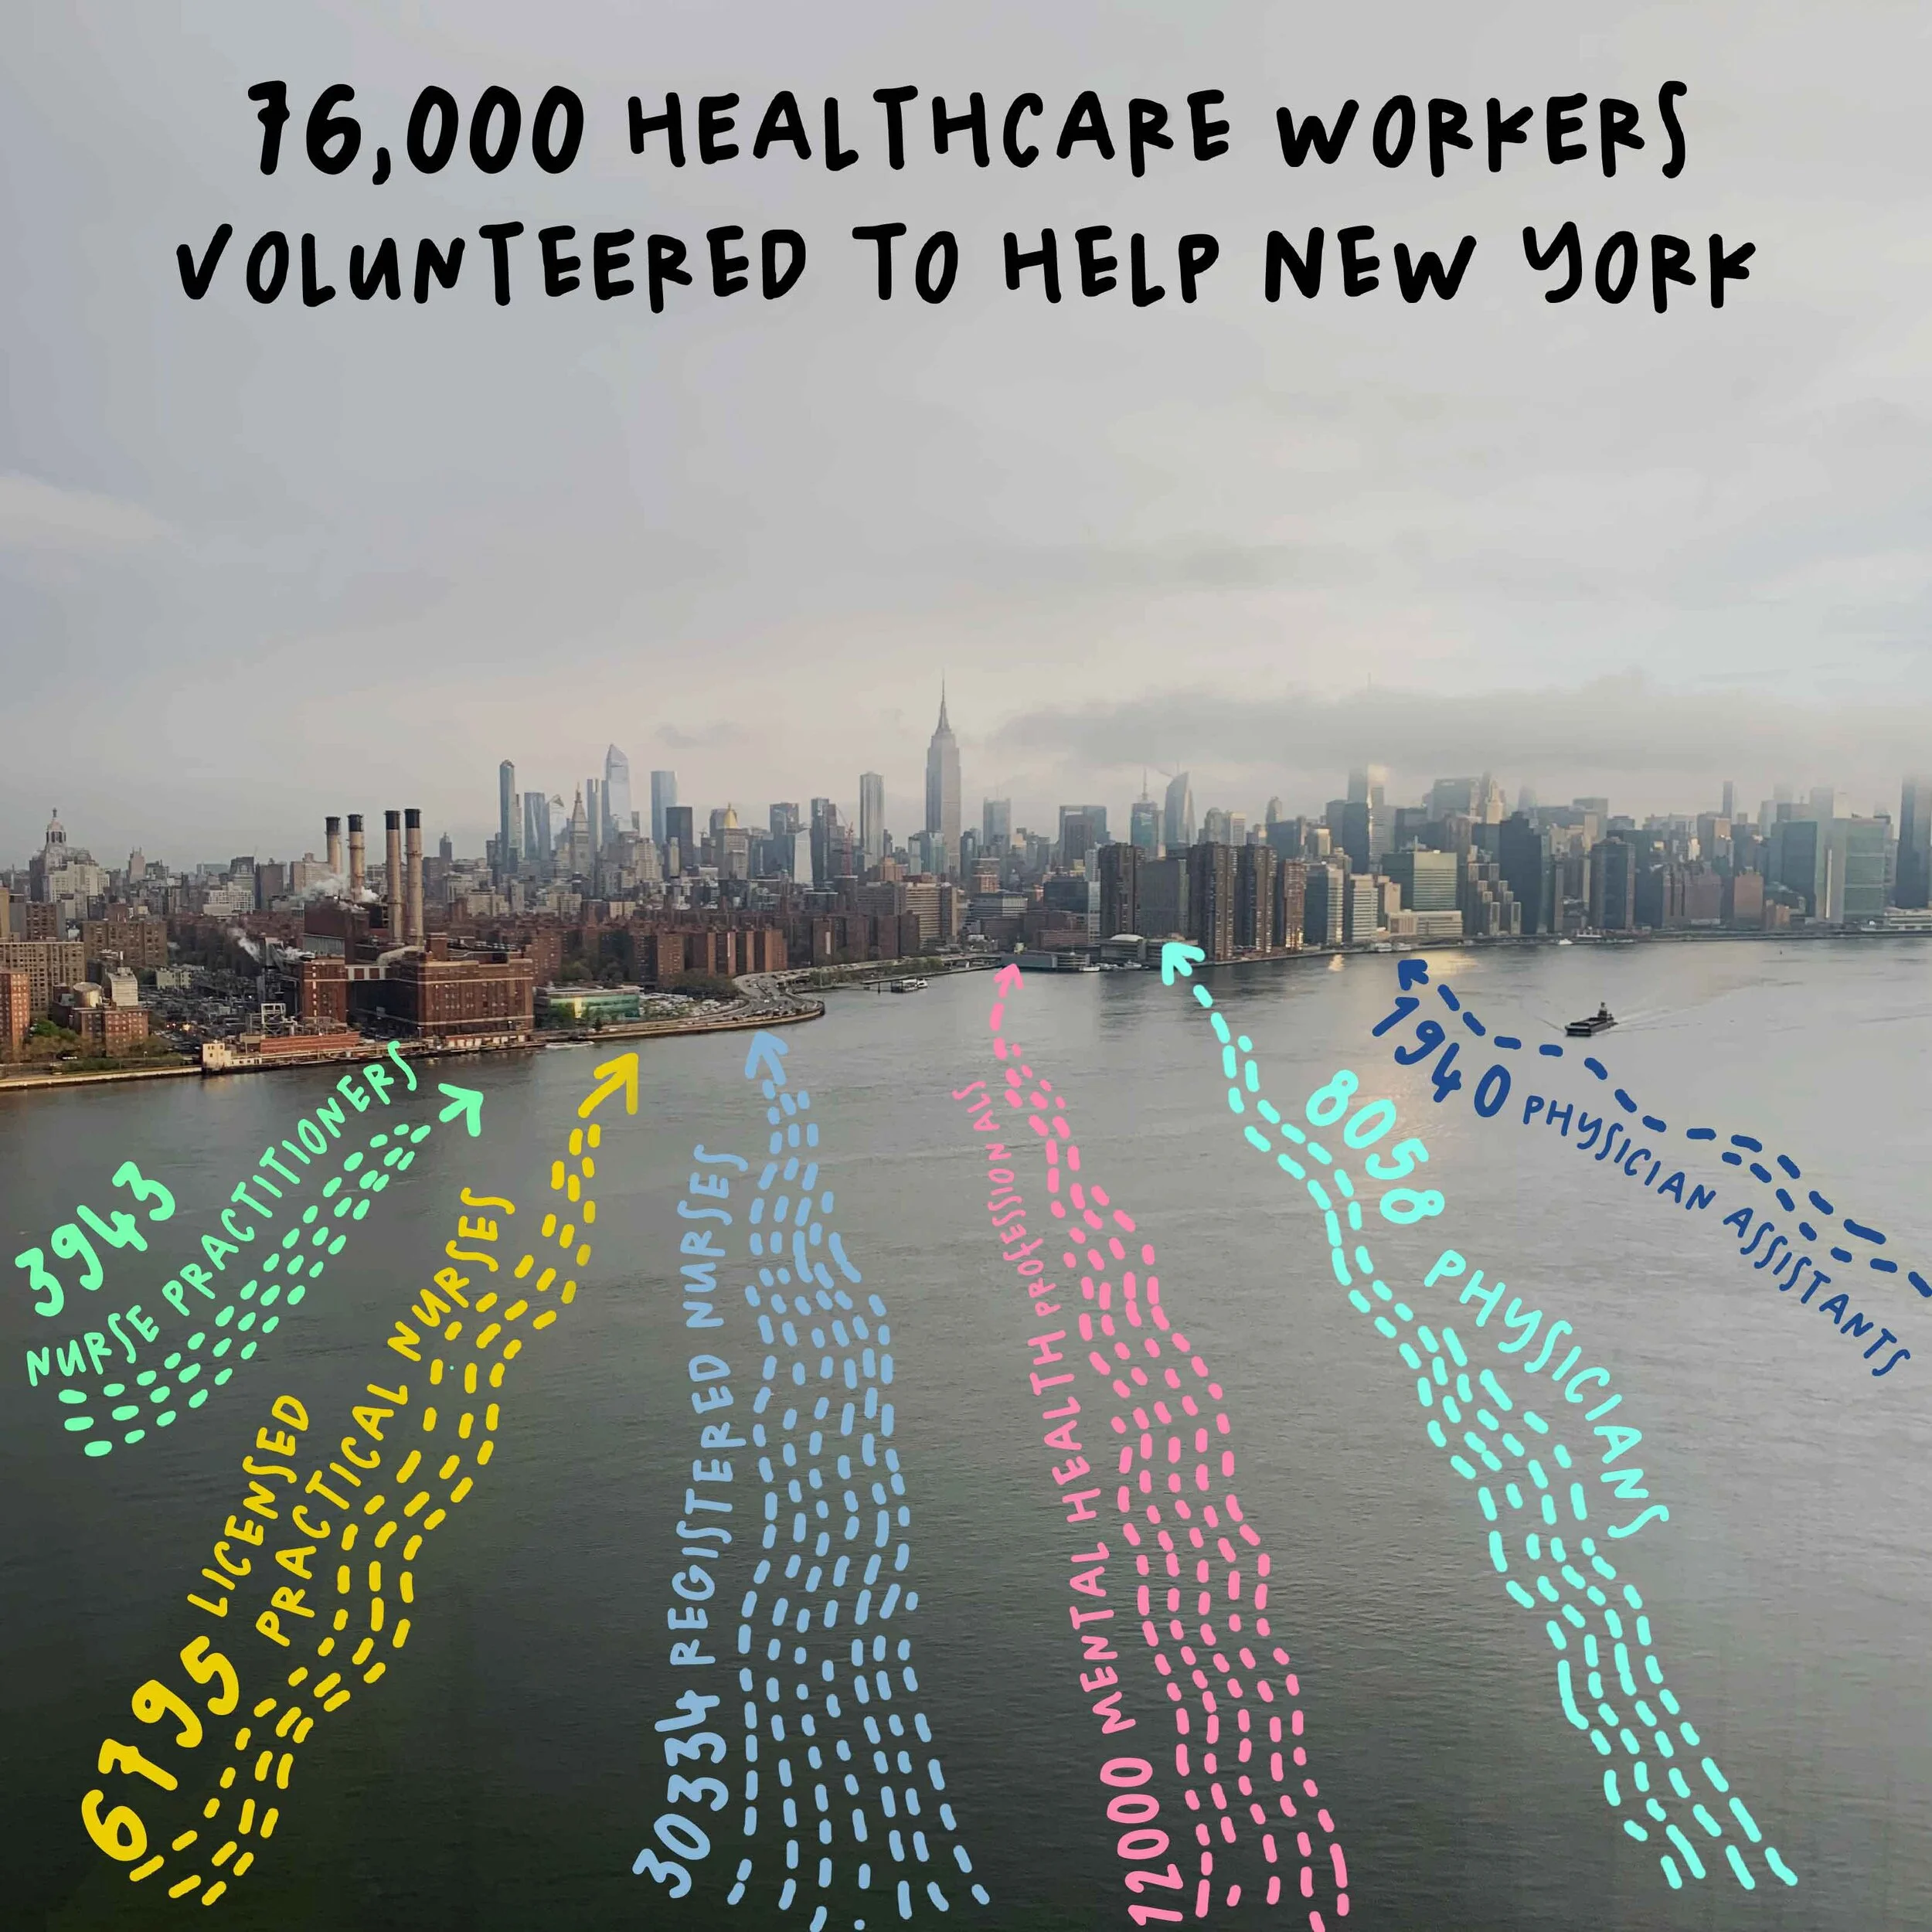
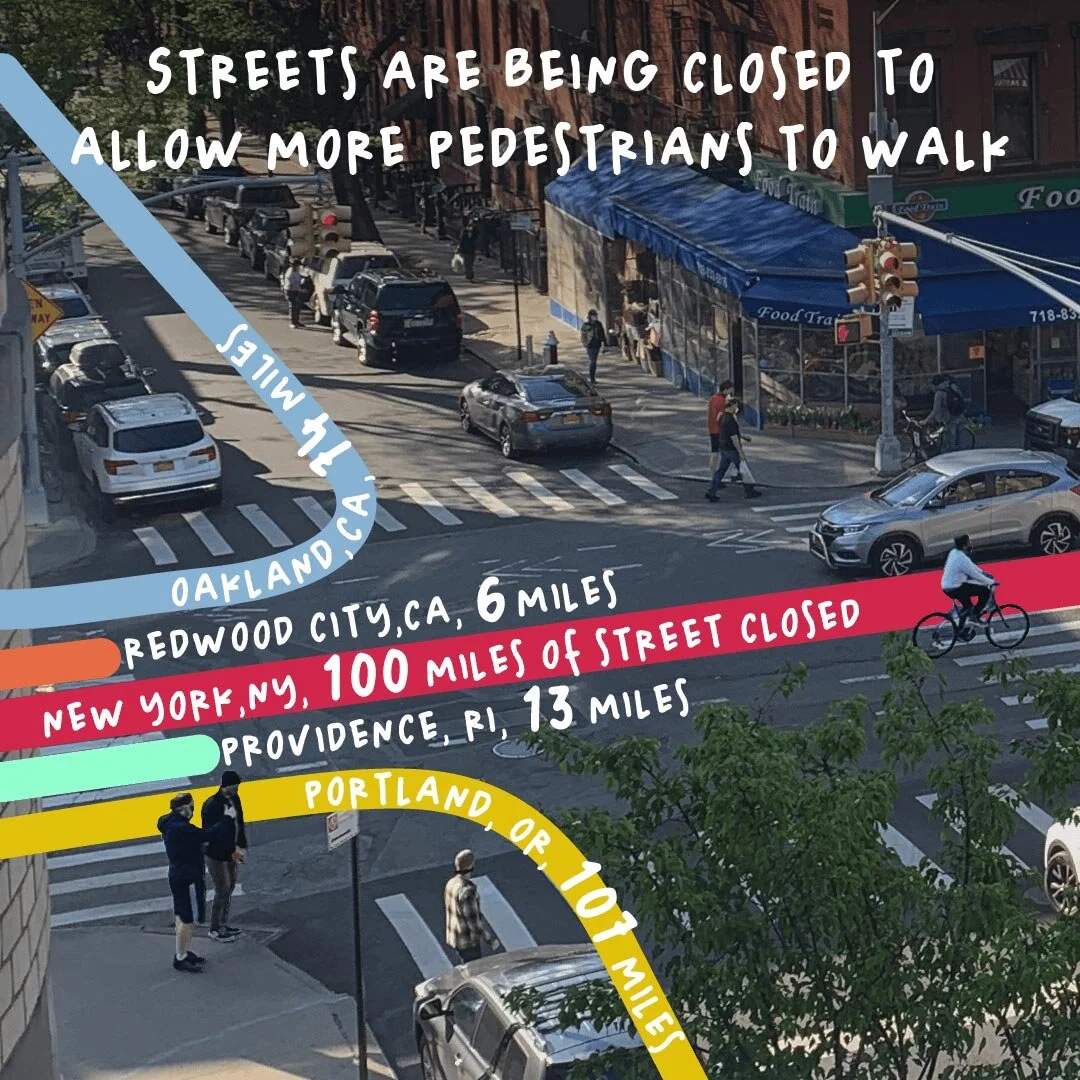
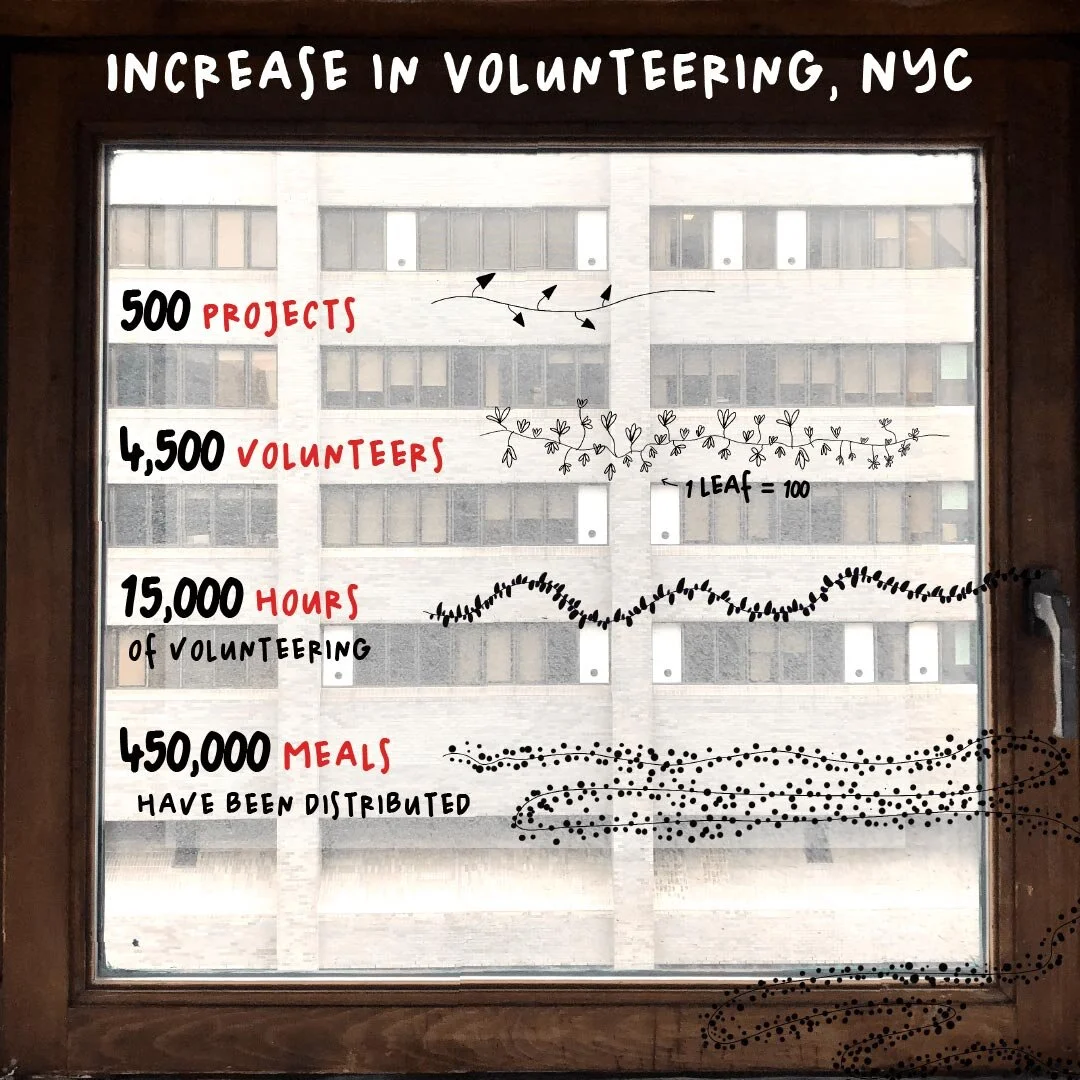
A series of data visualizations look for the positive during a time of crisis.
The visualizations combine hand-drawn type and infographics with photo snapshots taken by the team and their friends, using the information as a lens on current events.
Inspired by these window-side daydreams, we started searching far and wide for Happy Data: small but mighty numbers that, while insignificant to the more urgent statistics about the virus’s toll, helped picture a new reality post-pandemic. Then, using windows at home as canvases, they visualized this data to create metaphorical “views” onto a more joyful and positive future.
The project has been covered by Fast Company, Creative Review, PAGE, Gràffica, and PEN Magazine.
Full project detail↗